Afghan vs Immigrants from the Azores Child Poverty Among Girls Under 16
COMPARE
Afghan
Immigrants from the Azores
Child Poverty Among Girls Under 16
Child Poverty Among Girls Under 16 Comparison
Afghans
Immigrants from the Azores
16.2%
CHILD POVERTY AMONG GIRLS UNDER 16
62.3/ 100
METRIC RATING
172nd/ 347
METRIC RANK
16.8%
CHILD POVERTY AMONG GIRLS UNDER 16
31.3/ 100
METRIC RATING
191st/ 347
METRIC RANK
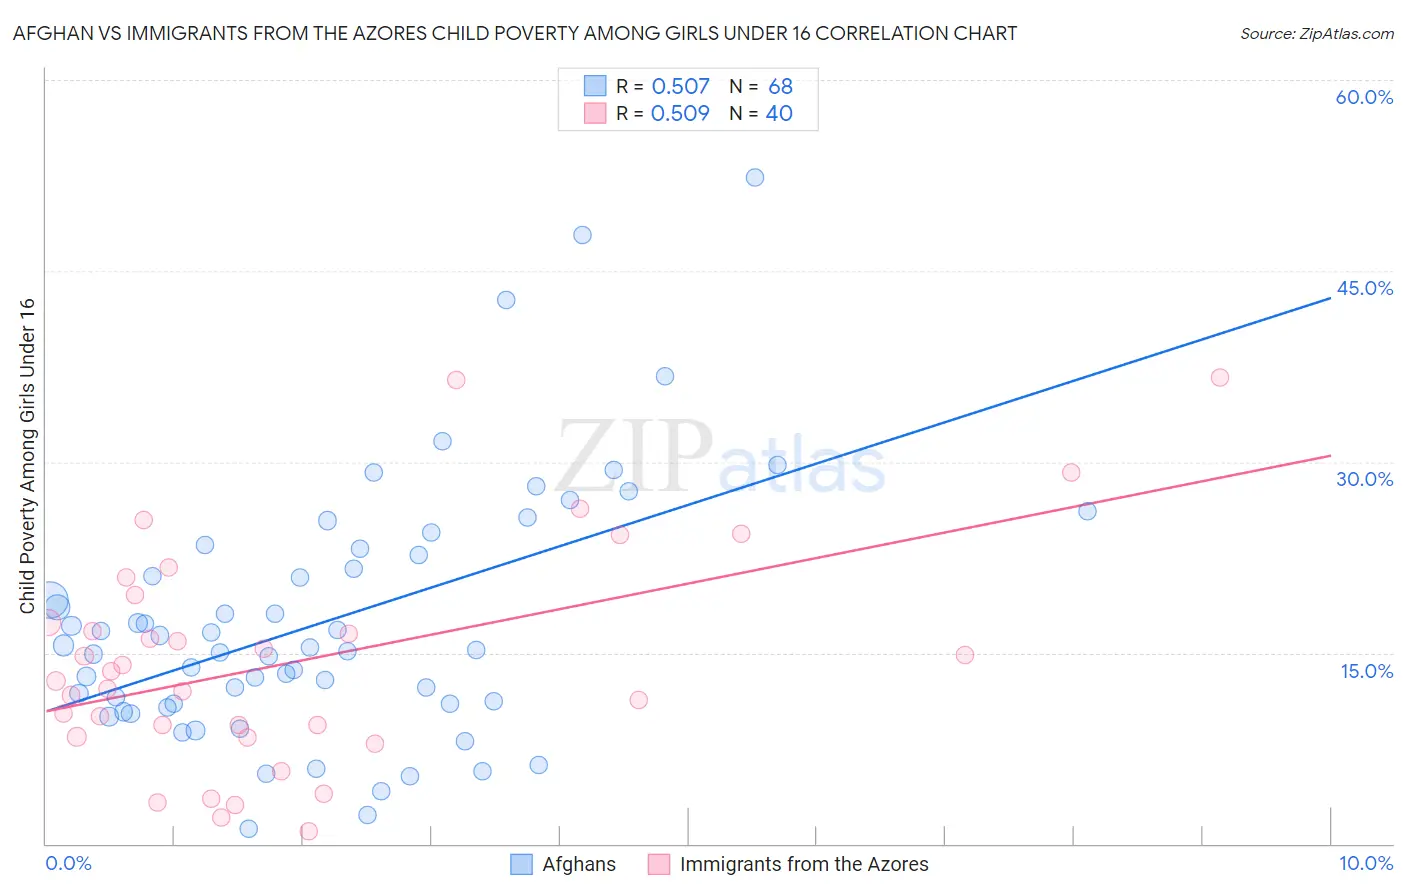
Afghan vs Immigrants from the Azores Child Poverty Among Girls Under 16 Correlation Chart
The statistical analysis conducted on geographies consisting of 147,871,316 people shows a substantial positive correlation between the proportion of Afghans and poverty level among girls under the age of 16 in the United States with a correlation coefficient (R) of 0.507 and weighted average of 16.2%. Similarly, the statistical analysis conducted on geographies consisting of 45,828,269 people shows a substantial positive correlation between the proportion of Immigrants from the Azores and poverty level among girls under the age of 16 in the United States with a correlation coefficient (R) of 0.509 and weighted average of 16.8%, a difference of 3.8%.
Child Poverty Among Girls Under 16 Correlation Summary
| Measurement | Afghan | Immigrants from the Azores |
| Minimum | 1.2% | 0.96% |
| Maximum | 52.3% | 36.6% |
| Range | 51.1% | 35.6% |
| Mean | 17.5% | 14.4% |
| Median | 15.3% | 13.2% |
| Interquartile 25% (IQ1) | 11.0% | 8.8% |
| Interquartile 75% (IQ3) | 23.0% | 18.5% |
| Interquartile Range (IQR) | 12.0% | 9.6% |
| Standard Deviation (Sample) | 10.0% | 8.7% |
| Standard Deviation (Population) | 10.0% | 8.6% |
Demographics Similar to Afghans and Immigrants from the Azores by Child Poverty Among Girls Under 16
In terms of child poverty among girls under 16, the demographic groups most similar to Afghans are Immigrants from Saudi Arabia (16.2%, a difference of 0.21%), Immigrants from South America (16.4%, a difference of 0.88%), Ethiopian (16.5%, a difference of 1.5%), Lebanese (16.6%, a difference of 2.0%), and Hungarian (16.6%, a difference of 2.0%). Similarly, the demographic groups most similar to Immigrants from the Azores are Kenyan (16.8%, a difference of 0.12%), Immigrants from Bosnia and Herzegovina (16.8%, a difference of 0.16%), Arab (16.8%, a difference of 0.41%), Immigrants from Morocco (16.8%, a difference of 0.42%), and South American Indian (16.8%, a difference of 0.47%).
| Demographics | Rating | Rank | Child Poverty Among Girls Under 16 |
| Immigrants | Saudi Arabia | 64.0 /100 | #171 | Good 16.2% |
| Afghans | 62.3 /100 | #172 | Good 16.2% |
| Immigrants | South America | 55.1 /100 | #173 | Average 16.4% |
| Ethiopians | 50.0 /100 | #174 | Average 16.5% |
| Lebanese | 45.4 /100 | #175 | Average 16.6% |
| Hungarians | 45.1 /100 | #176 | Average 16.6% |
| Immigrants | Western Asia | 44.1 /100 | #177 | Average 16.6% |
| Whites/Caucasians | 43.6 /100 | #178 | Average 16.6% |
| Hawaiians | 43.4 /100 | #179 | Average 16.6% |
| Immigrants | Syria | 43.3 /100 | #180 | Average 16.6% |
| Immigrants | Iraq | 43.2 /100 | #181 | Average 16.6% |
| Immigrants | Ethiopia | 43.1 /100 | #182 | Average 16.6% |
| Immigrants | Portugal | 42.5 /100 | #183 | Average 16.6% |
| Scotch-Irish | 39.6 /100 | #184 | Fair 16.7% |
| Immigrants | Uruguay | 35.6 /100 | #185 | Fair 16.7% |
| South American Indians | 35.0 /100 | #186 | Fair 16.8% |
| Immigrants | Morocco | 34.6 /100 | #187 | Fair 16.8% |
| Arabs | 34.5 /100 | #188 | Fair 16.8% |
| Immigrants | Bosnia and Herzegovina | 32.5 /100 | #189 | Fair 16.8% |
| Kenyans | 32.3 /100 | #190 | Fair 16.8% |
| Immigrants | Azores | 31.3 /100 | #191 | Fair 16.8% |