Afghan vs Immigrants from Sierra Leone Child Poverty Under the Age of 5
COMPARE
Afghan
Immigrants from Sierra Leone
Child Poverty Under the Age of 5
Child Poverty Under the Age of 5 Comparison
Afghans
Immigrants from Sierra Leone
16.8%
CHILD POVERTY UNDER THE AGE OF 5
74.4/ 100
METRIC RATING
156th/ 347
METRIC RANK
17.3%
CHILD POVERTY UNDER THE AGE OF 5
43.6/ 100
METRIC RATING
177th/ 347
METRIC RANK
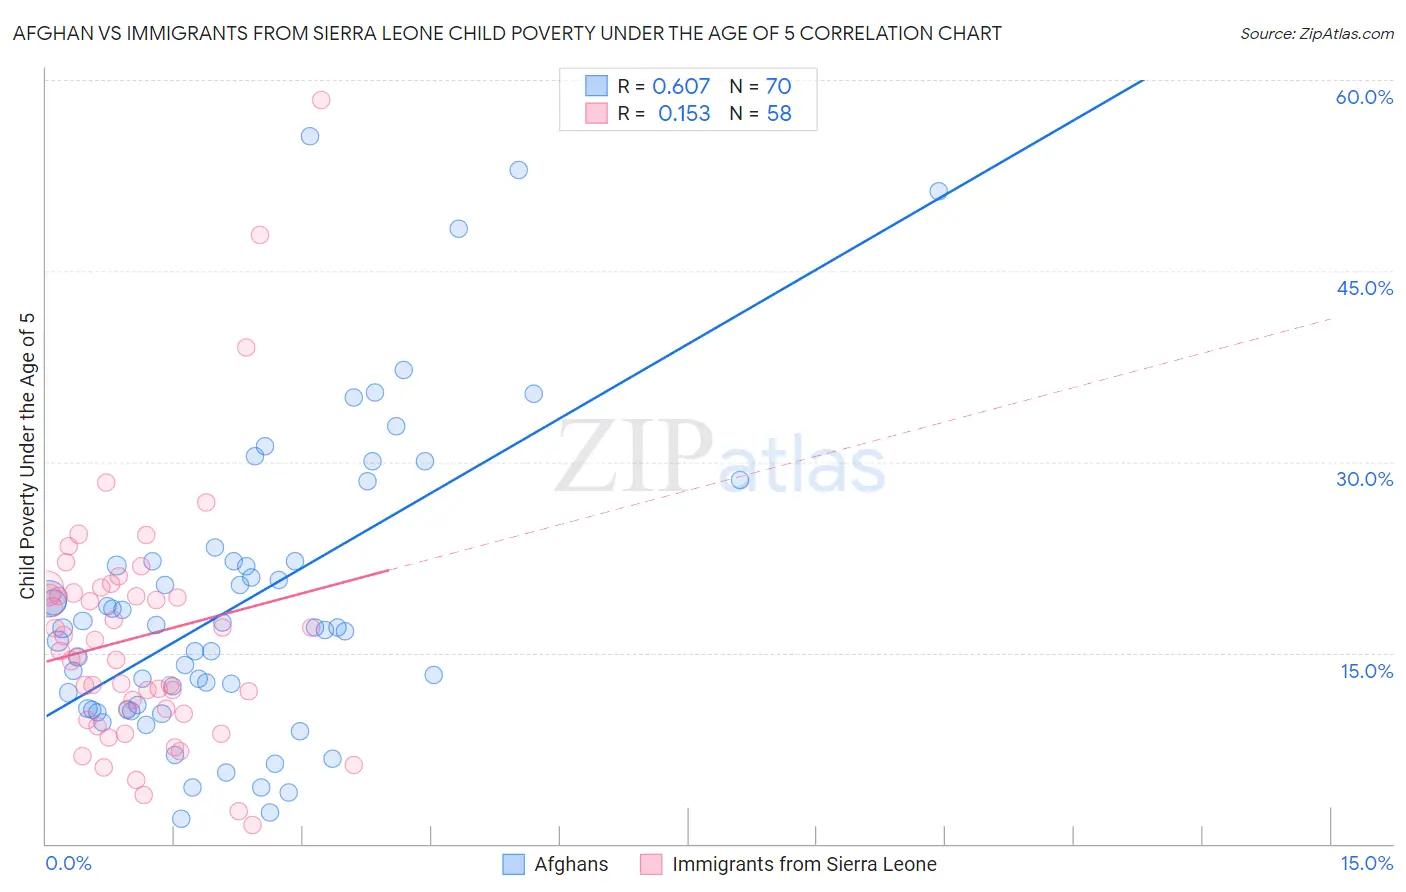
Afghan vs Immigrants from Sierra Leone Child Poverty Under the Age of 5 Correlation Chart
The statistical analysis conducted on geographies consisting of 146,489,297 people shows a significant positive correlation between the proportion of Afghans and poverty level among children under the age of 5 in the United States with a correlation coefficient (R) of 0.607 and weighted average of 16.8%. Similarly, the statistical analysis conducted on geographies consisting of 100,756,435 people shows a poor positive correlation between the proportion of Immigrants from Sierra Leone and poverty level among children under the age of 5 in the United States with a correlation coefficient (R) of 0.153 and weighted average of 17.3%, a difference of 3.5%.
Child Poverty Under the Age of 5 Correlation Summary
| Measurement | Afghan | Immigrants from Sierra Leone |
| Minimum | 2.0% | 1.5% |
| Maximum | 55.6% | 58.4% |
| Range | 53.6% | 57.0% |
| Mean | 19.0% | 16.3% |
| Median | 16.9% | 14.9% |
| Interquartile 25% (IQ1) | 10.6% | 10.2% |
| Interquartile 75% (IQ3) | 22.2% | 19.7% |
| Interquartile Range (IQR) | 11.6% | 9.5% |
| Standard Deviation (Sample) | 11.8% | 9.9% |
| Standard Deviation (Population) | 11.7% | 9.8% |
Similar Demographics by Child Poverty Under the Age of 5
Demographics Similar to Afghans by Child Poverty Under the Age of 5
In terms of child poverty under the age of 5, the demographic groups most similar to Afghans are Venezuelan (16.8%, a difference of 0.090%), South American (16.7%, a difference of 0.10%), Immigrants from Venezuela (16.7%, a difference of 0.23%), Czechoslovakian (16.8%, a difference of 0.26%), and Immigrants from Syria (16.8%, a difference of 0.29%).
| Demographics | Rating | Rank | Child Poverty Under the Age of 5 |
| New Zealanders | 78.7 /100 | #149 | Good 16.6% |
| Colombians | 77.8 /100 | #150 | Good 16.7% |
| Canadians | 77.6 /100 | #151 | Good 16.7% |
| Belgians | 77.2 /100 | #152 | Good 16.7% |
| Dutch | 77.1 /100 | #153 | Good 16.7% |
| Immigrants | Venezuela | 76.0 /100 | #154 | Good 16.7% |
| South Americans | 75.1 /100 | #155 | Good 16.7% |
| Afghans | 74.4 /100 | #156 | Good 16.8% |
| Venezuelans | 73.7 /100 | #157 | Good 16.8% |
| Czechoslovakians | 72.5 /100 | #158 | Good 16.8% |
| Immigrants | Syria | 72.3 /100 | #159 | Good 16.8% |
| Irish | 72.0 /100 | #160 | Good 16.8% |
| English | 70.4 /100 | #161 | Good 16.8% |
| Costa Ricans | 69.8 /100 | #162 | Good 16.9% |
| Scottish | 68.6 /100 | #163 | Good 16.9% |
Demographics Similar to Immigrants from Sierra Leone by Child Poverty Under the Age of 5
In terms of child poverty under the age of 5, the demographic groups most similar to Immigrants from Sierra Leone are Immigrants from Cameroon (17.4%, a difference of 0.10%), Immigrants from Iraq (17.3%, a difference of 0.16%), Hawaiian (17.4%, a difference of 0.23%), South American Indian (17.4%, a difference of 0.23%), and Immigrants from Germany (17.4%, a difference of 0.28%).
| Demographics | Rating | Rank | Child Poverty Under the Age of 5 |
| Immigrants | Western Asia | 59.2 /100 | #170 | Average 17.1% |
| Immigrants | Morocco | 58.9 /100 | #171 | Average 17.1% |
| Yugoslavians | 54.1 /100 | #172 | Average 17.2% |
| Welsh | 54.0 /100 | #173 | Average 17.2% |
| Immigrants | Saudi Arabia | 50.0 /100 | #174 | Average 17.2% |
| Immigrants | Lebanon | 47.6 /100 | #175 | Average 17.3% |
| Immigrants | Iraq | 45.2 /100 | #176 | Average 17.3% |
| Immigrants | Sierra Leone | 43.6 /100 | #177 | Average 17.3% |
| Immigrants | Cameroon | 42.7 /100 | #178 | Average 17.4% |
| Hawaiians | 41.5 /100 | #179 | Average 17.4% |
| South American Indians | 41.4 /100 | #180 | Average 17.4% |
| Immigrants | Germany | 41.0 /100 | #181 | Average 17.4% |
| Arabs | 40.7 /100 | #182 | Average 17.4% |
| Lebanese | 40.3 /100 | #183 | Average 17.4% |
| Immigrants | Costa Rica | 39.0 /100 | #184 | Fair 17.4% |