Zip Codes with the Highest Percentage of Population Working from Home in Toledo, OH

RELATED REPORTS & OPTIONS

Work from Home
Population
Families and Households
Female Fertility
Female Fertility (Unmarried)
Race (Community Size)
Race (Percentage)
Ancestry (Community Size)
AfghanAfricanAlsatianAmericanApacheArabArmenianAustrianBelgianBhutaneseBlackfeetBrazilianBritishBulgarianBurmeseCanadianCelticCentral AmericanCentral American IndianCherokeeChippewaChoctawColombianComancheCosta RicanCreekCroatianCubanCypriotCzechCzechoslovakianDanishDominicanDutchEastern EuropeanEcuadorianEgyptianEnglishEuropeanFinnishFrenchFrench American IndianFrench CanadianGermanGerman RussianGhanaianGreekGuamanian / ChamorroGuatemalanGuyaneseHaitianHonduranHungarianIndian (Asian)IranianIraqiIrishIroquoisIsraeliItalianJamaicanJapaneseJordanianKenyanKoreanLaotianLebaneseLiberianLithuanianMacedonianMalaysianMalteseMexicanMexican American IndianNative HawaiianNavajoNicaraguanNigerianNorthern EuropeanNorwegianPakistaniPalestinianPanamanianParaguayanPennsylvania GermanPeruvianPolishPortuguesePuerto RicanRomanianRussianSalvadoranSamoanScandinavianScotch-IrishScottishSeminoleSerbianShoshoneSiouxSlavicSlovakSloveneSouth AfricanSouth AmericanSpaniardSpanishSri LankanSubsaharan AfricanSudaneseSwedishSwissSyrianThaiTrinidadian and TobagonianTurkishUkrainianVenezuelanWelshWest IndianYugoslavian
Ancestry (Percentage)
AfghanAfricanAlsatianAmericanApacheArabArmenianAustrianBelgianBhutaneseBlackfeetBrazilianBritishBulgarianBurmeseCanadianCelticCentral AmericanCentral American IndianCherokeeChippewaChoctawColombianComancheCosta RicanCreekCroatianCubanCypriotCzechCzechoslovakianDanishDominicanDutchEastern EuropeanEcuadorianEgyptianEnglishEuropeanFinnishFrenchFrench American IndianFrench CanadianGermanGerman RussianGhanaianGreekGuamanian / ChamorroGuatemalanGuyaneseHaitianHonduranHungarianIndian (Asian)IranianIraqiIrishIroquoisIsraeliItalianJamaicanJapaneseJordanianKenyanKoreanLaotianLebaneseLiberianLithuanianMacedonianMalaysianMalteseMexicanMexican American IndianNative HawaiianNavajoNicaraguanNigerianNorthern EuropeanNorwegianPakistaniPalestinianPanamanianParaguayanPennsylvania GermanPeruvianPolishPortuguesePuerto RicanRomanianRussianSalvadoranSamoanScandinavianScotch-IrishScottishSeminoleSerbianShoshoneSiouxSlavicSlovakSloveneSouth AfricanSouth AmericanSpaniardSpanishSri LankanSubsaharan AfricanSudaneseSwedishSwissSyrianThaiTrinidadian and TobagonianTurkishUkrainianVenezuelanWelshWest IndianYugoslavian
Immigrant Origin (Total)
Immigrant Origin (Percentage)
Income
Income (Families)
Income (Households)
Poverty
Poverty (Families)
Unemployment
Employment Occupations
Employment Industries
Employer Class
Commute Time
Commute Means
School Enrollment
Education by Degree Field
Occupancy
Finances
Physical Characteristics
Toledo
Compare Zip Codes
Comparison Subject

Map of Zip Codes with the Highest Percentage of Population Working from Home in Toledo

31.9%
52.8%
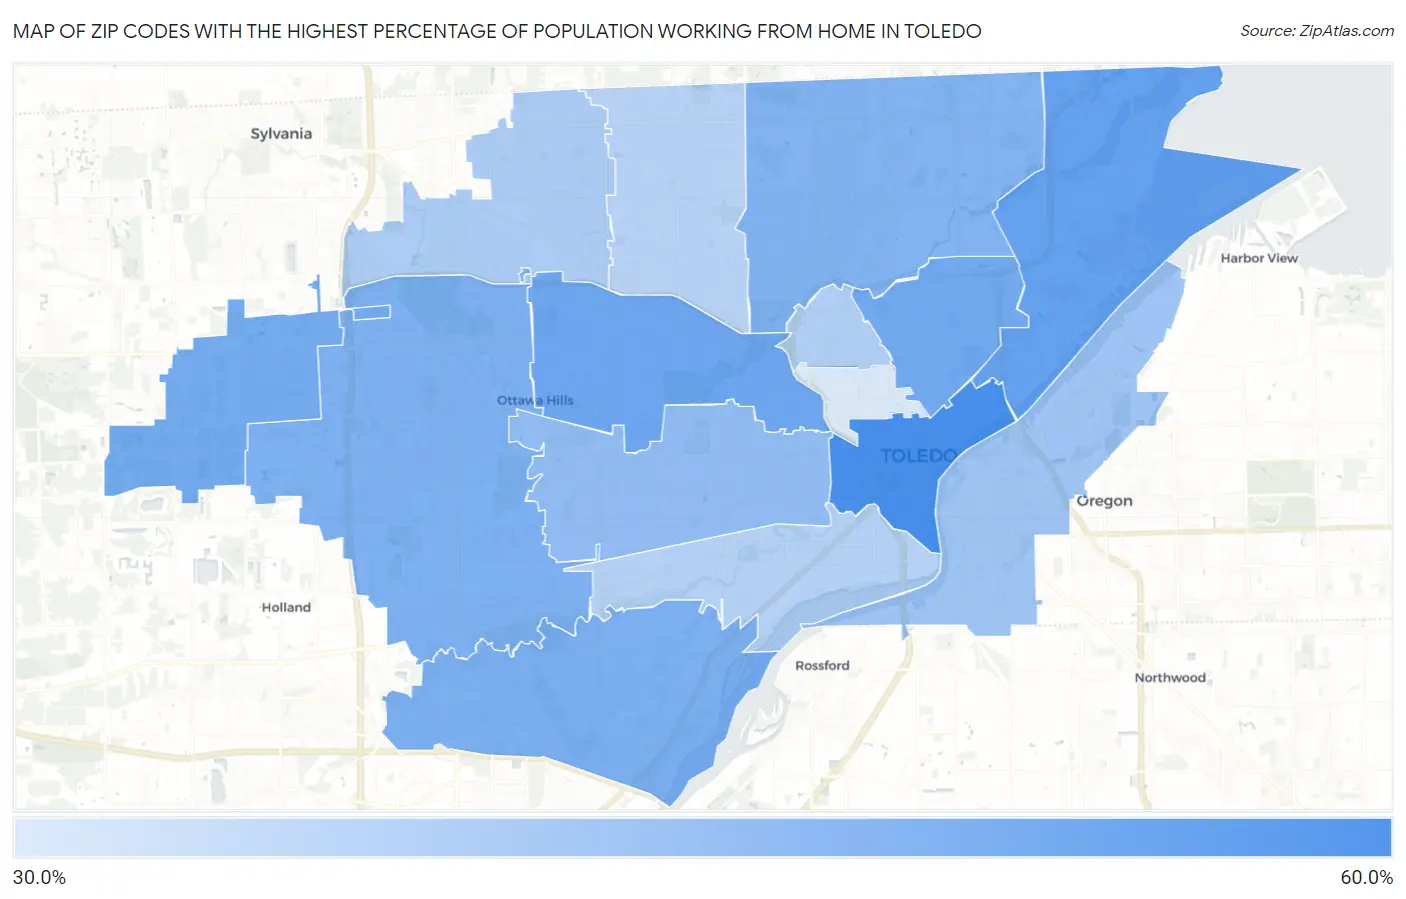
Zip Codes with the Highest Percentage of Population Working from Home in Toledo Map

Zip Codes with the Highest Percentage of Population Working from Home in Toledo, OH

Zip Code % Work from Home vs State vs National
1. 43604 52.8% 44.6% (+8.20)#180 44.0% (+8.80)#6,007
2. 43611 48.3% 44.6% (+3.70)#356 44.0% (+4.30)#10,478
3. 43606 47.0% 44.6% (+2.40)#412 44.0% (+3.00)#11,982
4. 43608 46.4% 44.6% (+1.80)#440 44.0% (+2.40)#12,731
5. 43617 45.9% 44.6% (+1.30)#470 44.0% (+1.90)#13,289
6. 43614 45.1% 44.6% (+0.500)#504 44.0% (+1.10)#14,218
7. 43615 44.8% 44.6% (+0.200)#513 44.0% (+0.800)#14,545
8. 43612 44.5% 44.6% (-0.100)#535 44.0% (+0.500)#14,931
9. 43607 42.0% 44.6% (-2.60)#630 44.0% (-2.00)#17,705
10. 43605 40.2% 44.6% (-4.40)#700 44.0% (-3.80)#19,453
11. 43623 38.3% 44.6% (-6.30)#748 44.0% (-5.70)#20,890
12. 43610 37.7% 44.6% (-6.90)#769 44.0% (-6.30)#21,306
13. 43609 37.1% 44.6% (-7.50)#783 44.0% (-6.90)#21,615
14. 43613 36.8% 44.6% (-7.80)#786 44.0% (-7.20)#21,766
15. 43620 31.9% 44.6% (-12.7)#856 44.0% (-12.1)#23,538

Common Questions

What are the Top 10 Zip Codes with the Highest Percentage of Population Working from Home in Toledo, OH?
Top 10 Zip Codes with the Highest Percentage of Population Working from Home in Toledo, OH are:
#1
52.8%
#2
48.3%
#3
47.0%
#4
46.4%
#5
45.9%
#6
45.1%
#7
44.8%
#8
44.5%
#9
42.0%
#10
40.2%
What zip code has the Highest Percentage of Population Working from Home in Toledo, OH?
43604 has the Highest Percentage of Population Working from Home in Toledo, OH with 52.8%.
What is the Percentage of Population Working from Home in Toledo, OH?
Percentage of Population Working from Home in Toledo is 42.4%.
What is the Percentage of Population Working from Home in Ohio?
Percentage of Population Working from Home in Ohio is 44.6%.
What is the Percentage of Population Working from Home in the United States?
Percentage of Population Working from Home in the United States is 44.0%.