Zip Codes with the Most Births per 1,000 Women in Labor Force in Toledo, OH

RELATED REPORTS & OPTIONS

Highest Birth Rate | In Labor Force
Population
Families and Households
Female Fertility
Female Fertility (Unmarried)
Race (Community Size)
Race (Percentage)
Ancestry (Community Size)
AfghanAfricanAlsatianAmericanApacheArabArmenianAustrianBelgianBhutaneseBlackfeetBrazilianBritishBulgarianBurmeseCanadianCelticCentral AmericanCentral American IndianCherokeeChippewaChoctawColombianComancheCosta RicanCreekCroatianCubanCypriotCzechCzechoslovakianDanishDominicanDutchEastern EuropeanEcuadorianEgyptianEnglishEuropeanFinnishFrenchFrench American IndianFrench CanadianGermanGerman RussianGhanaianGreekGuamanian / ChamorroGuatemalanGuyaneseHaitianHonduranHungarianIndian (Asian)IranianIraqiIrishIroquoisIsraeliItalianJamaicanJapaneseJordanianKenyanKoreanLaotianLebaneseLiberianLithuanianMacedonianMalaysianMalteseMexicanMexican American IndianNative HawaiianNavajoNicaraguanNigerianNorthern EuropeanNorwegianPakistaniPalestinianPanamanianParaguayanPennsylvania GermanPeruvianPolishPortuguesePuerto RicanRomanianRussianSalvadoranSamoanScandinavianScotch-IrishScottishSeminoleSerbianShoshoneSiouxSlavicSlovakSloveneSouth AfricanSouth AmericanSpaniardSpanishSri LankanSubsaharan AfricanSudaneseSwedishSwissSyrianThaiTrinidadian and TobagonianTurkishUkrainianVenezuelanWelshWest IndianYugoslavian
Ancestry (Percentage)
AfghanAfricanAlsatianAmericanApacheArabArmenianAustrianBelgianBhutaneseBlackfeetBrazilianBritishBulgarianBurmeseCanadianCelticCentral AmericanCentral American IndianCherokeeChippewaChoctawColombianComancheCosta RicanCreekCroatianCubanCypriotCzechCzechoslovakianDanishDominicanDutchEastern EuropeanEcuadorianEgyptianEnglishEuropeanFinnishFrenchFrench American IndianFrench CanadianGermanGerman RussianGhanaianGreekGuamanian / ChamorroGuatemalanGuyaneseHaitianHonduranHungarianIndian (Asian)IranianIraqiIrishIroquoisIsraeliItalianJamaicanJapaneseJordanianKenyanKoreanLaotianLebaneseLiberianLithuanianMacedonianMalaysianMalteseMexicanMexican American IndianNative HawaiianNavajoNicaraguanNigerianNorthern EuropeanNorwegianPakistaniPalestinianPanamanianParaguayanPennsylvania GermanPeruvianPolishPortuguesePuerto RicanRomanianRussianSalvadoranSamoanScandinavianScotch-IrishScottishSeminoleSerbianShoshoneSiouxSlavicSlovakSloveneSouth AfricanSouth AmericanSpaniardSpanishSri LankanSubsaharan AfricanSudaneseSwedishSwissSyrianThaiTrinidadian and TobagonianTurkishUkrainianVenezuelanWelshWest IndianYugoslavian
Immigrant Origin (Total)
Immigrant Origin (Percentage)
Income
Income (Families)
Income (Households)
Poverty
Poverty (Families)
Unemployment
Employment Occupations
Employment Industries
Employer Class
Commute Time
Commute Means
School Enrollment
Education by Degree Field
Occupancy
Finances
Physical Characteristics
Toledo
Compare Zip Codes
Comparison Subject

Map of Zip Codes with the Most Births per 1,000 Women in Labor Force in Toledo

16.0
128.0
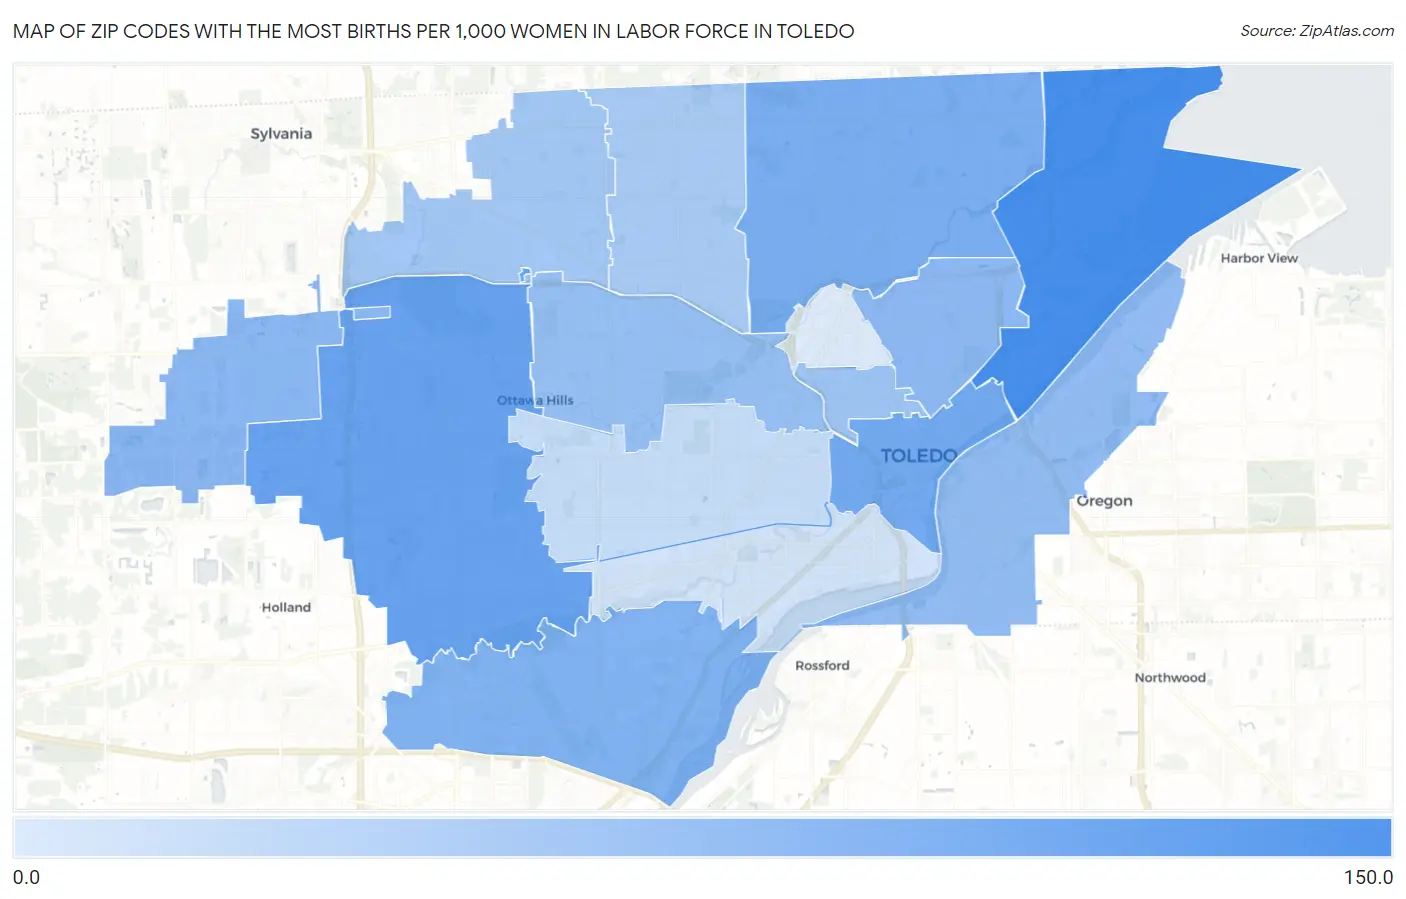
Zip Codes with the Most Births per 1,000 Women in Labor Force in Toledo Map

Zip Codes with the Most Births per 1,000 Women in Labor Force in Toledo, OH

Zip Code Births / 1,000 Women vs State vs National
1. 43611 128.0 51.0 (+77.0)#81 48.0 (+80.0)#2,237
2. 43615 82.0 51.0 (+31.0)#205 48.0 (+34.0)#5,012
3. 43604 71.0 51.0 (+20.0)#269 48.0 (+23.0)#6,561
4. 43612 63.0 51.0 (+12.0)#334 48.0 (+15.0)#8,057
5. 43614 59.0 51.0 (+8.00)#376 48.0 (+11.0)#8,954
6. 43617 51.0 51.0 (=0.000)#463 48.0 (+3.00)#11,195
7. 43608 49.0 51.0 (-2.00)#489 48.0 (+1.000)#11,768
8. 43605 47.0 51.0 (-4.00)#506 48.0 (-1.000)#12,299
9. 43606 44.0 51.0 (-7.00)#552 48.0 (-4.00)#13,251
10. 43620 39.0 51.0 (-12.0)#610 48.0 (-9.00)#15,028
11. 43623 36.0 51.0 (-15.0)#635 48.0 (-12.0)#15,903
12. 43613 34.0 51.0 (-17.0)#654 48.0 (-14.0)#16,452
13. 43607 22.0 51.0 (-29.0)#771 48.0 (-26.0)#19,999
14. 43609 19.0 51.0 (-32.0)#800 48.0 (-29.0)#20,755
15. 43610 16.0 51.0 (-35.0)#824 48.0 (-32.0)#21,448

Common Questions

What are the Top 10 Zip Codes with the Most Births per 1,000 Women in Labor Force in Toledo, OH?
Top 10 Zip Codes with the Most Births per 1,000 Women in Labor Force in Toledo, OH are:
#1
128.0
#2
82.0
#3
71.0
#4
63.0
#5
59.0
#6
51.0
#7
49.0
#8
47.0
#9
44.0
#10
39.0
What zip code has the Most Births per 1,000 Women in Labor Force in Toledo, OH?
43611 has the Most Births per 1,000 Women in Labor Force in Toledo, OH with 128.0.
What is the Number of Births per 1,000 Women in Labor Force in Toledo, OH?
Number of Births per 1,000 Women in Labor Force in Toledo is 56.0.
What is the Number of Births per 1,000 Women in Labor Force in Ohio?
Number of Births per 1,000 Women in Labor Force in Ohio is 51.0.
What is the Number of Births per 1,000 Women in Labor Force in the United States?
Number of Births per 1,000 Women in Labor Force in the United States is 48.0.