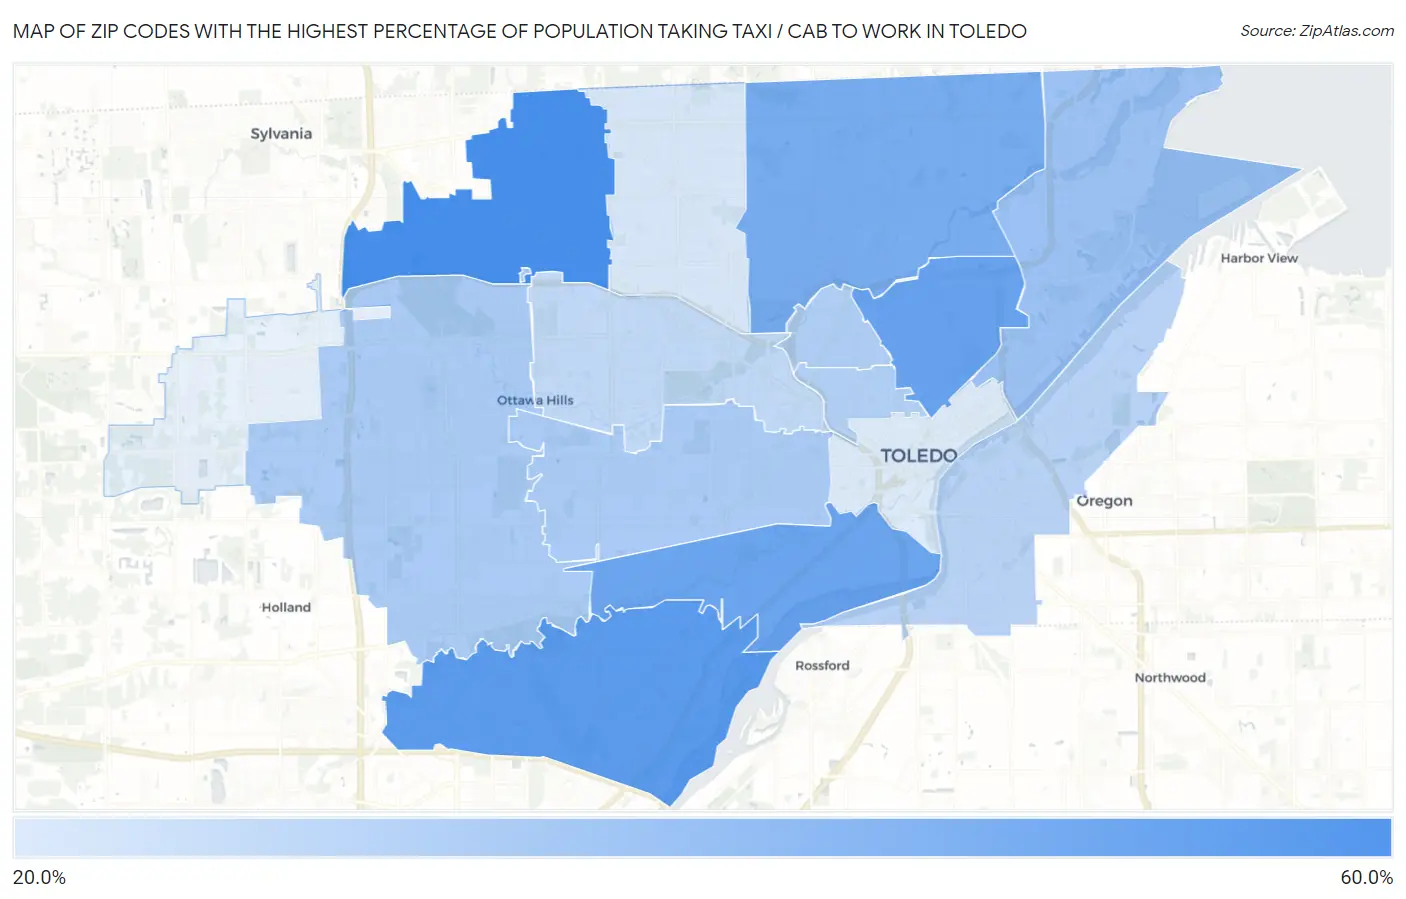
Zip Codes with the Highest Percentage of Population Taking Taxi / Cab to Work in Toledo, OH
RELATED REPORTS & OPTIONS
Taxi / Cab
Toledo
Compare Zip Codes
Map of Zip Codes with the Highest Percentage of Population Taking Taxi / Cab to Work in Toledo
23.9%
57.1%
Zip Codes with the Highest Percentage of Population Taking Taxi / Cab to Work in Toledo, OH
| Zip Code | % Take Taxi / Cab | vs State | vs National | |
| 1. | 43623 | 57.1% | 37.6%(+19.5)#48 | 38.2%(+18.9)#1,158 |
| 2. | 43614 | 52.7% | 37.6%(+15.1)#89 | 38.2%(+14.5)#2,176 |
| 3. | 43608 | 49.4% | 37.6%(+11.8)#133 | 38.2%(+11.2)#3,143 |
| 4. | 43609 | 48.4% | 37.6%(+10.8)#139 | 38.2%(+10.2)#3,471 |
| 5. | 43612 | 45.4% | 37.6%(+7.80)#169 | 38.2%(+7.20)#4,505 |
| 6. | 43611 | 37.4% | 37.6%(-0.200)#258 | 38.2%(-0.800)#7,779 |
| 7. | 43607 | 34.5% | 37.6%(-3.10)#301 | 38.2%(-3.70)#9,133 |
| 8. | 43615 | 34.3% | 37.6%(-3.30)#306 | 38.2%(-3.90)#9,213 |
| 9. | 43610 | 33.3% | 37.6%(-4.30)#326 | 38.2%(-4.90)#9,680 |
| 10. | 43620 | 32.5% | 37.6%(-5.10)#340 | 38.2%(-5.70)#10,016 |
| 11. | 43605 | 31.4% | 37.6%(-6.20)#351 | 38.2%(-6.80)#10,401 |
| 12. | 43606 | 29.6% | 37.6%(-8.00)#366 | 38.2%(-8.60)#11,061 |
| 13. | 43613 | 24.7% | 37.6%(-12.9)#429 | 38.2%(-13.5)#12,300 |
| 14. | 43604 | 23.9% | 37.6%(-13.7)#437 | 38.2%(-14.3)#12,469 |
1
Common Questions
What are the Top 10 Zip Codes with the Highest Percentage of Population Taking Taxi / Cab to Work in Toledo, OH?
Top 10 Zip Codes with the Highest Percentage of Population Taking Taxi / Cab to Work in Toledo, OH are:
What zip code has the Highest Percentage of Population Taking Taxi / Cab to Work in Toledo, OH?
43623 has the Highest Percentage of Population Taking Taxi / Cab to Work in Toledo, OH with 57.1%.
What is the Percentage of Population Taking Taxi / Cab to Work in Toledo, OH?
Percentage of Population Taking Taxi / Cab to Work in Toledo is 34.6%.
What is the Percentage of Population Taking Taxi / Cab to Work in Ohio?
Percentage of Population Taking Taxi / Cab to Work in Ohio is 37.6%.
What is the Percentage of Population Taking Taxi / Cab to Work in the United States?
Percentage of Population Taking Taxi / Cab to Work in the United States is 38.2%.