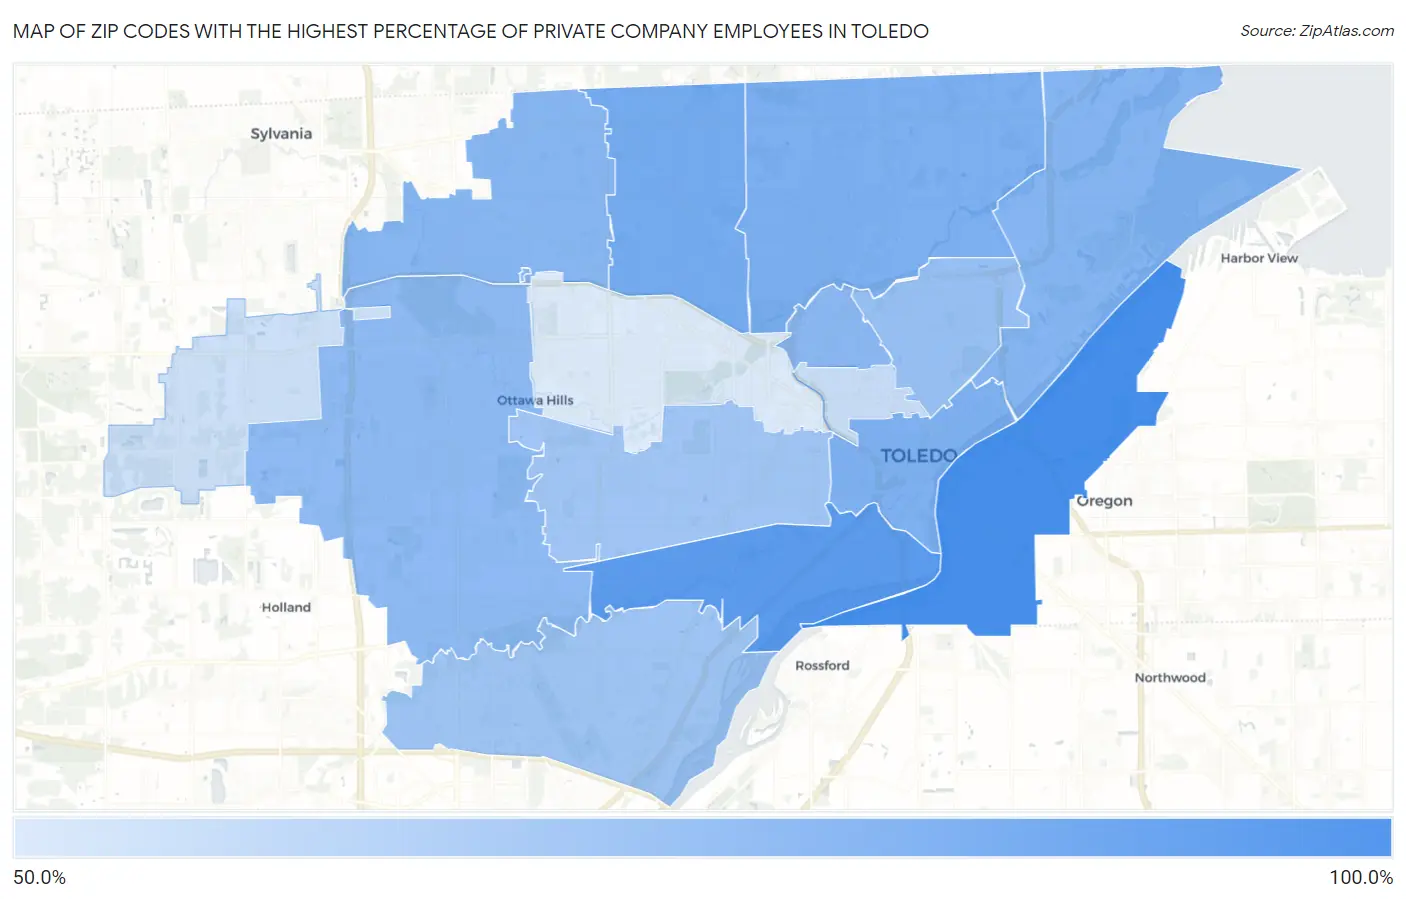
Zip Codes with the Highest Percentage of Private Company Employees in Toledo, OH
RELATED REPORTS & OPTIONS
Private Company Employees
Toledo
Compare Zip Codes
Map of Zip Codes with the Highest Percentage of Private Company Employees in Toledo
59.1%
82.7%
Zip Codes with the Highest Percentage of Private Company Employees in Toledo, OH
| Zip Code | % Private Company Employees | vs State | vs National | |
| 1. | 43605 | 82.7% | 69.5%(+13.2)#94 | 66.9%(+15.8)#1,663 |
| 2. | 43609 | 79.4% | 69.5%(+9.96)#160 | 66.9%(+12.5)#2,506 |
| 3. | 43613 | 75.2% | 69.5%(+5.79)#317 | 66.9%(+8.35)#4,723 |
| 4. | 43612 | 74.0% | 69.5%(+4.52)#398 | 66.9%(+7.08)#5,792 |
| 5. | 43604 | 73.5% | 69.5%(+4.04)#423 | 66.9%(+6.60)#6,237 |
| 6. | 43611 | 72.3% | 69.5%(+2.90)#496 | 66.9%(+5.46)#7,452 |
| 7. | 43623 | 72.0% | 69.5%(+2.53)#520 | 66.9%(+5.09)#7,852 |
| 8. | 43610 | 71.7% | 69.5%(+2.28)#534 | 66.9%(+4.84)#8,123 |
| 9. | 43615 | 70.9% | 69.5%(+1.43)#589 | 66.9%(+4.00)#9,186 |
| 10. | 43608 | 69.7% | 69.5%(+0.237)#657 | 66.9%(+2.80)#10,774 |
| 11. | 43614 | 68.5% | 69.5%(-0.960)#734 | 66.9%(+1.60)#12,363 |
| 12. | 43607 | 68.3% | 69.5%(-1.17)#742 | 66.9%(+1.40)#12,667 |
| 13. | 43620 | 62.0% | 69.5%(-7.42)#1,022 | 66.9%(-4.86)#20,372 |
| 14. | 43617 | 61.5% | 69.5%(-7.96)#1,046 | 66.9%(-5.40)#20,961 |
| 15. | 43606 | 59.1% | 69.5%(-10.4)#1,090 | 66.9%(-7.80)#23,195 |
1
Common Questions
What are the Top 10 Zip Codes with the Highest Percentage of Private Company Employees in Toledo, OH?
Top 10 Zip Codes with the Highest Percentage of Private Company Employees in Toledo, OH are:
What zip code has the Highest Percentage of Private Company Employees in Toledo, OH?
43605 has the Highest Percentage of Private Company Employees in Toledo, OH with 82.7%.
What is the Percentage of Private Company Employees in Toledo, OH?
Percentage of Private Company Employees in Toledo is 72.0%.
What is the Percentage of Private Company Employees in Ohio?
Percentage of Private Company Employees in Ohio is 69.5%.
What is the Percentage of Private Company Employees in the United States?
Percentage of Private Company Employees in the United States is 66.9%.