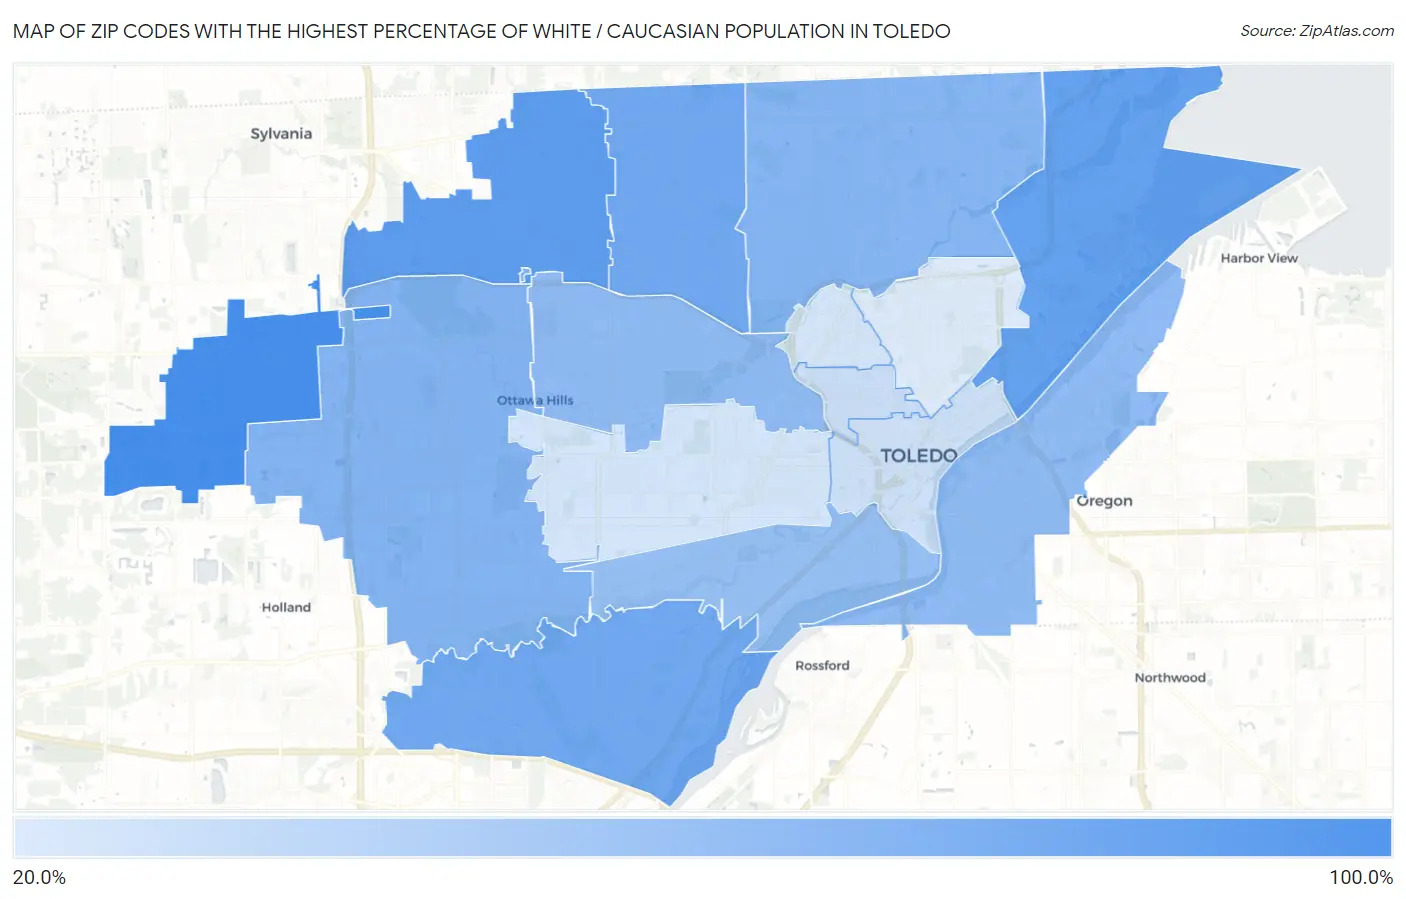
Zip Codes with the Highest Percentage of White / Caucasian Population in Toledo, OH
RELATED REPORTS & OPTIONS
White / Caucasian
Toledo
Compare Zip Codes
Map of Zip Codes with the Highest Percentage of White / Caucasian Population in Toledo
29.2%
94.1%
Zip Codes with the Highest Percentage of White / Caucasian Population in Toledo, OH
| Zip Code | White / Caucasian | vs State | vs National | |
| 1. | 43617 | 94.1% | 78.8%(+15.3)#614 | 65.9%(+28.2)#10,343 |
| 2. | 43623 | 82.4% | 78.8%(+3.61)#978 | 65.9%(+16.6)#19,791 |
| 3. | 43611 | 78.5% | 78.8%(-0.309)#1,014 | 65.9%(+12.6)#21,635 |
| 4. | 43614 | 73.5% | 78.8%(-5.31)#1,051 | 65.9%(+7.64)#23,578 |
| 5. | 43613 | 73.3% | 78.8%(-5.50)#1,053 | 65.9%(+7.45)#23,638 |
| 6. | 43615 | 65.0% | 78.8%(-13.8)#1,095 | 65.9%(-0.900)#26,124 |
| 7. | 43612 | 64.3% | 78.8%(-14.6)#1,097 | 65.9%(-1.61)#26,318 |
| 8. | 43605 | 60.3% | 78.8%(-18.5)#1,111 | 65.9%(-5.59)#27,217 |
| 9. | 43606 | 60.0% | 78.8%(-18.8)#1,113 | 65.9%(-5.84)#27,286 |
| 10. | 43609 | 56.8% | 78.8%(-22.0)#1,128 | 65.9%(-9.07)#27,937 |
| 11. | 43620 | 35.9% | 78.8%(-43.0)#1,173 | 65.9%(-30.0)#30,983 |
| 12. | 43604 | 34.7% | 78.8%(-44.1)#1,175 | 65.9%(-31.2)#31,088 |
| 13. | 43610 | 32.5% | 78.8%(-46.3)#1,179 | 65.9%(-33.4)#31,272 |
| 14. | 43607 | 32.1% | 78.8%(-46.8)#1,180 | 65.9%(-33.8)#31,324 |
| 15. | 43608 | 29.2% | 78.8%(-49.6)#1,187 | 65.9%(-36.7)#31,558 |
1
Common Questions
What are the Top 10 Zip Codes with the Highest Percentage of White / Caucasian Population in Toledo, OH?
Top 10 Zip Codes with the Highest Percentage of White / Caucasian Population in Toledo, OH are:
What zip code has the Highest Percentage of White / Caucasian Population in Toledo, OH?
43617 has the Highest Percentage of White / Caucasian Population in Toledo, OH with 94.1%.
What is the Percentage of White / Caucasian Population in Toledo, OH?
Percentage of White / Caucasian Population in Toledo is 59.6%.
What is the Percentage of White / Caucasian Population in Ohio?
Percentage of White / Caucasian Population in Ohio is 78.8%.
What is the Percentage of White / Caucasian Population in the United States?
Percentage of White / Caucasian Population in the United States is 65.9%.