Zip Codes with the Highest Percentage of Population Employed in Health Diagnosing & Treating in Chesterfield, MO
RELATED REPORTS & OPTIONS
Health Diagnosing & Treating
Chesterfield
Compare Zip Codes
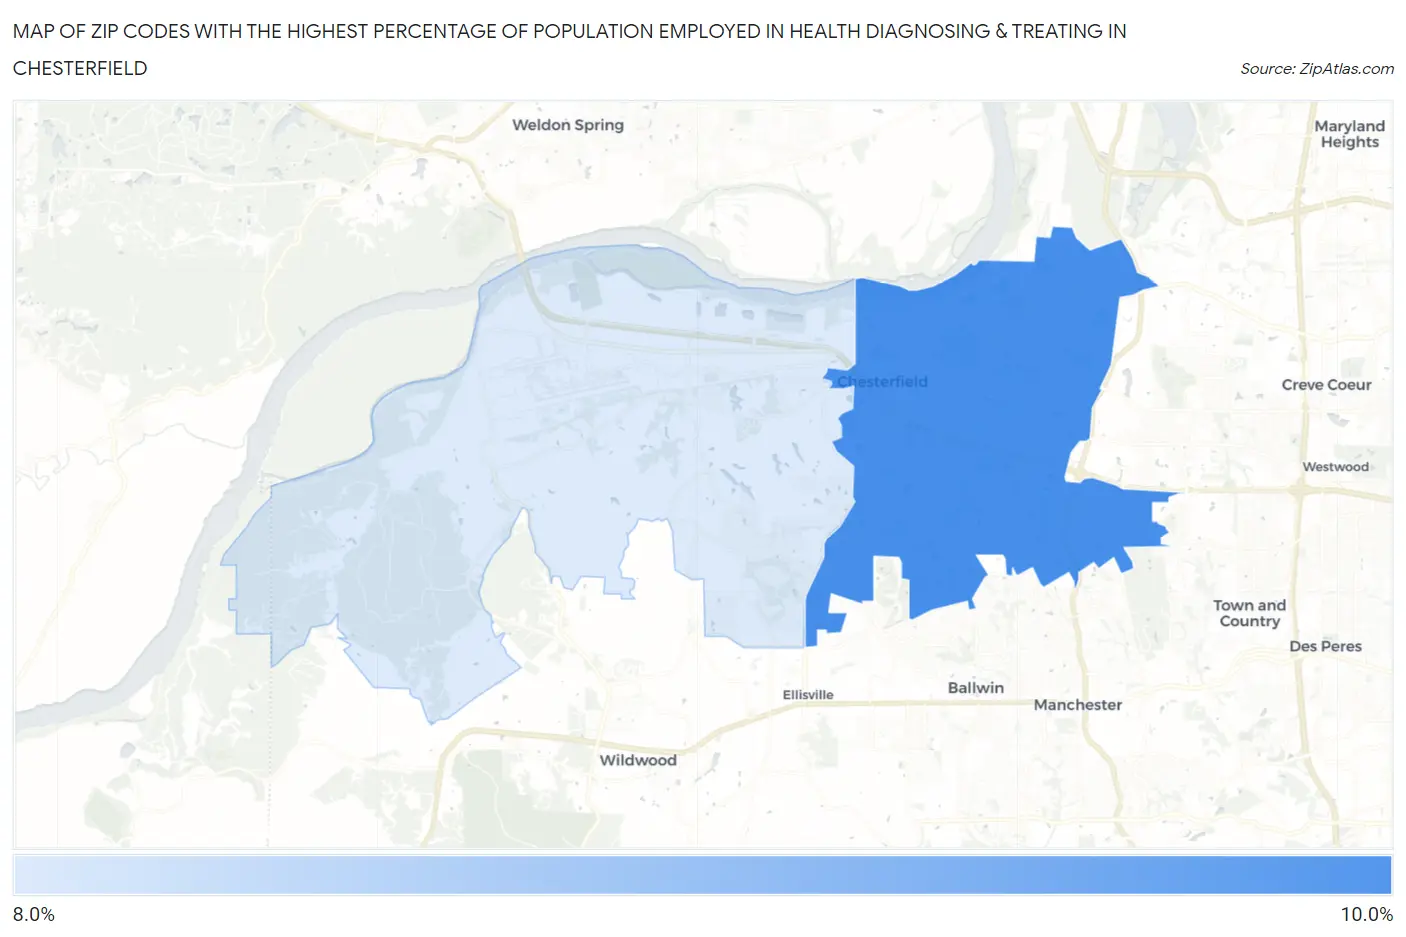
Map of Zip Codes with the Highest Percentage of Population Employed in Health Diagnosing & Treating in Chesterfield
8.3%
9.0%
Zip Codes with the Highest Percentage of Population Employed in Health Diagnosing & Treating in Chesterfield, MO
| Zip Code | % Employed | vs State | vs National | |
| 1. | 63017 | 9.0% | 6.9%(+2.10)#186 | 6.2%(+2.77)#5,352 |
| 2. | 63005 | 8.3% | 6.9%(+1.38)#230 | 6.2%(+2.05)#6,795 |
1
Common Questions
What are the Top Zip Codes with the Highest Percentage of Population Employed in Health Diagnosing & Treating in Chesterfield, MO?
Top Zip Codes with the Highest Percentage of Population Employed in Health Diagnosing & Treating in Chesterfield, MO are:
What zip code has the Highest Percentage of Population Employed in Health Diagnosing & Treating in Chesterfield, MO?
63017 has the Highest Percentage of Population Employed in Health Diagnosing & Treating in Chesterfield, MO with 9.0%.
What is the Percentage of Population Employed in Health Diagnosing & Treating in Chesterfield, MO?
Percentage of Population Employed in Health Diagnosing & Treating in Chesterfield is 7.7%.
What is the Percentage of Population Employed in Health Diagnosing & Treating in Missouri?
Percentage of Population Employed in Health Diagnosing & Treating in Missouri is 6.9%.
What is the Percentage of Population Employed in Health Diagnosing & Treating in the United States?
Percentage of Population Employed in Health Diagnosing & Treating in the United States is 6.2%.