Yuman vs Peruvian In Labor Force | Age 16-19
COMPARE
Yuman
Peruvian
In Labor Force | Age 16-19
In Labor Force | Age 16-19 Comparison
Yuman
Peruvians
27.7%
IN LABOR FORCE | AGE 16-19
0.0/ 100
METRIC RATING
343rd/ 347
METRIC RANK
34.6%
IN LABOR FORCE | AGE 16-19
1.4/ 100
METRIC RATING
255th/ 347
METRIC RANK
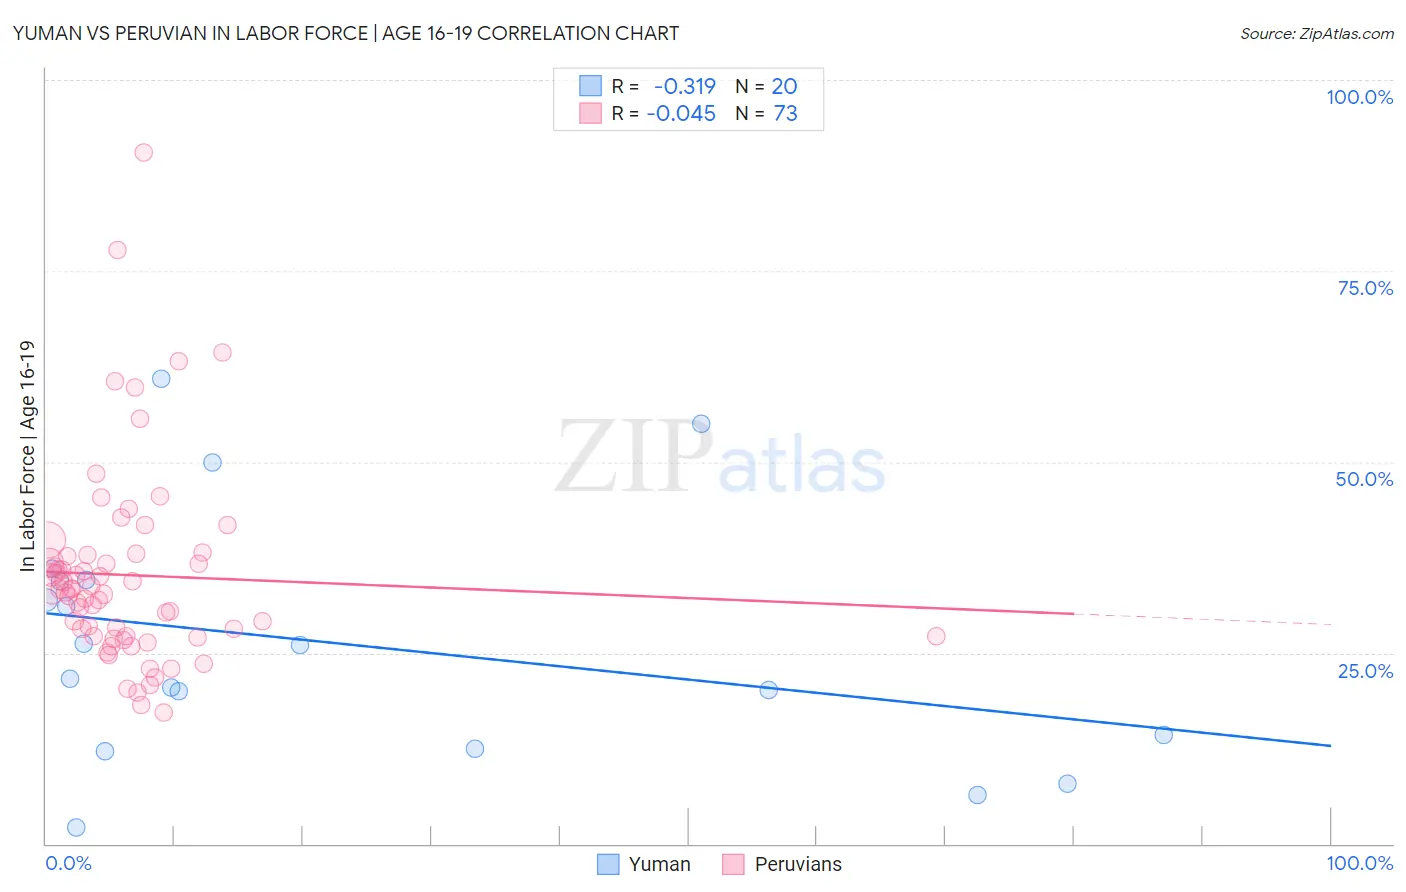
Yuman vs Peruvian In Labor Force | Age 16-19 Correlation Chart
The statistical analysis conducted on geographies consisting of 40,663,980 people shows a mild negative correlation between the proportion of Yuman and labor force participation rate among population between the ages 16 and 19 in the United States with a correlation coefficient (R) of -0.319 and weighted average of 27.7%. Similarly, the statistical analysis conducted on geographies consisting of 362,835,907 people shows no correlation between the proportion of Peruvians and labor force participation rate among population between the ages 16 and 19 in the United States with a correlation coefficient (R) of -0.045 and weighted average of 34.6%, a difference of 25.1%.
In Labor Force | Age 16-19 Correlation Summary
| Measurement | Yuman | Peruvian |
| Minimum | 2.2% | 17.1% |
| Maximum | 60.9% | 90.5% |
| Range | 58.7% | 73.4% |
| Mean | 26.2% | 35.2% |
| Median | 23.8% | 33.0% |
| Interquartile 25% (IQ1) | 13.4% | 27.1% |
| Interquartile 75% (IQ3) | 34.5% | 37.8% |
| Interquartile Range (IQR) | 21.1% | 10.6% |
| Standard Deviation (Sample) | 16.0% | 12.9% |
| Standard Deviation (Population) | 15.6% | 12.8% |
Similar Demographics by In Labor Force | Age 16-19
Demographics Similar to Yuman by In Labor Force | Age 16-19
In terms of in labor force | age 16-19, the demographic groups most similar to Yuman are Guyanese (27.4%, a difference of 0.76%), Immigrants from Guyana (27.3%, a difference of 1.4%), Immigrants from Barbados (29.0%, a difference of 4.8%), Immigrants from Armenia (29.0%, a difference of 5.0%), and British West Indian (29.1%, a difference of 5.2%).
| Demographics | Rating | Rank | In Labor Force | Age 16-19 |
| Immigrants | Hong Kong | 0.0 /100 | #333 | Tragic 30.5% |
| Puerto Ricans | 0.0 /100 | #334 | Tragic 30.3% |
| Immigrants | Cuba | 0.0 /100 | #335 | Tragic 30.2% |
| Immigrants | Trinidad and Tobago | 0.0 /100 | #336 | Tragic 30.2% |
| Immigrants | Bangladesh | 0.0 /100 | #337 | Tragic 30.0% |
| Vietnamese | 0.0 /100 | #338 | Tragic 29.6% |
| Immigrants | Uzbekistan | 0.0 /100 | #339 | Tragic 29.2% |
| British West Indians | 0.0 /100 | #340 | Tragic 29.1% |
| Immigrants | Armenia | 0.0 /100 | #341 | Tragic 29.0% |
| Immigrants | Barbados | 0.0 /100 | #342 | Tragic 29.0% |
| Yuman | 0.0 /100 | #343 | Tragic 27.7% |
| Guyanese | 0.0 /100 | #344 | Tragic 27.4% |
| Immigrants | Guyana | 0.0 /100 | #345 | Tragic 27.3% |
| Immigrants | St. Vincent and the Grenadines | 0.0 /100 | #346 | Tragic 26.3% |
| Immigrants | Grenada | 0.0 /100 | #347 | Tragic 25.4% |
Demographics Similar to Peruvians by In Labor Force | Age 16-19
In terms of in labor force | age 16-19, the demographic groups most similar to Peruvians are Bahamian (34.6%, a difference of 0.040%), Immigrants from South Central Asia (34.6%, a difference of 0.11%), Immigrants from Egypt (34.6%, a difference of 0.11%), Thai (34.6%, a difference of 0.12%), and Immigrants (34.6%, a difference of 0.13%).
| Demographics | Rating | Rank | In Labor Force | Age 16-19 |
| Central Americans | 2.2 /100 | #248 | Tragic 34.8% |
| Immigrants | Ukraine | 2.2 /100 | #249 | Tragic 34.8% |
| Immigrants | Pakistan | 2.0 /100 | #250 | Tragic 34.8% |
| Immigrants | Western Asia | 2.0 /100 | #251 | Tragic 34.8% |
| Immigrants | Chile | 2.0 /100 | #252 | Tragic 34.8% |
| Immigrants | Japan | 1.5 /100 | #253 | Tragic 34.7% |
| Bahamians | 1.4 /100 | #254 | Tragic 34.6% |
| Peruvians | 1.4 /100 | #255 | Tragic 34.6% |
| Immigrants | South Central Asia | 1.3 /100 | #256 | Tragic 34.6% |
| Immigrants | Egypt | 1.2 /100 | #257 | Tragic 34.6% |
| Thais | 1.2 /100 | #258 | Tragic 34.6% |
| Immigrants | Immigrants | 1.2 /100 | #259 | Tragic 34.6% |
| Egyptians | 1.2 /100 | #260 | Tragic 34.5% |
| Salvadorans | 1.1 /100 | #261 | Tragic 34.5% |
| Hispanics or Latinos | 1.1 /100 | #262 | Tragic 34.5% |