Northern European vs Immigrants from South Central Asia In Labor Force | Age 20-24
COMPARE
Northern European
Immigrants from South Central Asia
In Labor Force | Age 20-24
In Labor Force | Age 20-24 Comparison
Northern Europeans
Immigrants from South Central Asia
76.8%
IN LABOR FORCE | AGE 20-24
99.8/ 100
METRIC RATING
71st/ 347
METRIC RANK
74.0%
IN LABOR FORCE | AGE 20-24
1.9/ 100
METRIC RATING
244th/ 347
METRIC RANK
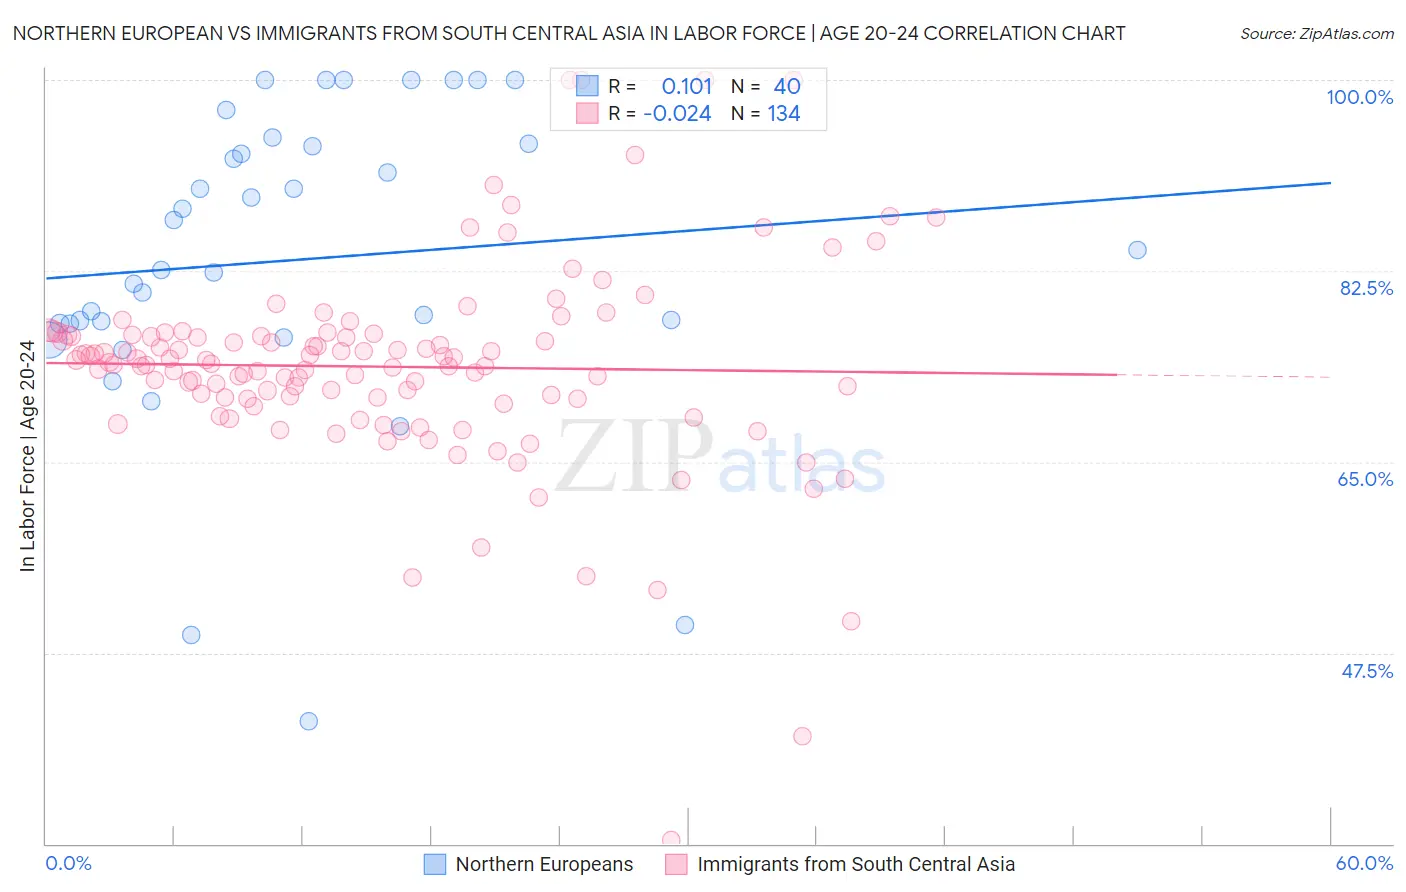
Northern European vs Immigrants from South Central Asia In Labor Force | Age 20-24 Correlation Chart
The statistical analysis conducted on geographies consisting of 405,750,071 people shows a poor positive correlation between the proportion of Northern Europeans and labor force participation rate among population between the ages 20 and 24 in the United States with a correlation coefficient (R) of 0.101 and weighted average of 76.8%. Similarly, the statistical analysis conducted on geographies consisting of 472,891,637 people shows no correlation between the proportion of Immigrants from South Central Asia and labor force participation rate among population between the ages 20 and 24 in the United States with a correlation coefficient (R) of -0.024 and weighted average of 74.0%, a difference of 3.8%.
In Labor Force | Age 20-24 Correlation Summary
| Measurement | Northern European | Immigrants from South Central Asia |
| Minimum | 41.2% | 30.3% |
| Maximum | 100.0% | 100.0% |
| Range | 58.8% | 69.7% |
| Mean | 83.5% | 73.7% |
| Median | 83.5% | 74.1% |
| Interquartile 25% (IQ1) | 77.7% | 70.8% |
| Interquartile 75% (IQ3) | 94.1% | 76.6% |
| Interquartile Range (IQR) | 16.4% | 5.8% |
| Standard Deviation (Sample) | 14.2% | 9.4% |
| Standard Deviation (Population) | 14.0% | 9.3% |
Similar Demographics by In Labor Force | Age 20-24
Demographics Similar to Northern Europeans by In Labor Force | Age 20-24
In terms of in labor force | age 20-24, the demographic groups most similar to Northern Europeans are Guamanian/Chamorro (76.7%, a difference of 0.030%), Ottawa (76.8%, a difference of 0.070%), Immigrants from Sudan (76.8%, a difference of 0.080%), British (76.7%, a difference of 0.080%), and French American Indian (76.8%, a difference of 0.10%).
| Demographics | Rating | Rank | In Labor Force | Age 20-24 |
| Whites/Caucasians | 99.9 /100 | #64 | Exceptional 76.9% |
| Crow | 99.9 /100 | #65 | Exceptional 76.9% |
| Icelanders | 99.9 /100 | #66 | Exceptional 76.9% |
| Slavs | 99.9 /100 | #67 | Exceptional 76.9% |
| French American Indians | 99.8 /100 | #68 | Exceptional 76.8% |
| Immigrants | Sudan | 99.8 /100 | #69 | Exceptional 76.8% |
| Ottawa | 99.8 /100 | #70 | Exceptional 76.8% |
| Northern Europeans | 99.8 /100 | #71 | Exceptional 76.8% |
| Guamanians/Chamorros | 99.8 /100 | #72 | Exceptional 76.7% |
| British | 99.8 /100 | #73 | Exceptional 76.7% |
| Cree | 99.7 /100 | #74 | Exceptional 76.6% |
| Immigrants | Middle Africa | 99.7 /100 | #75 | Exceptional 76.6% |
| Immigrants | Moldova | 99.6 /100 | #76 | Exceptional 76.6% |
| Immigrants | Cameroon | 99.6 /100 | #77 | Exceptional 76.6% |
| Canadians | 99.6 /100 | #78 | Exceptional 76.6% |
Demographics Similar to Immigrants from South Central Asia by In Labor Force | Age 20-24
In terms of in labor force | age 20-24, the demographic groups most similar to Immigrants from South Central Asia are Immigrants from Syria (74.0%, a difference of 0.010%), Turkish (73.9%, a difference of 0.030%), Immigrants from Senegal (74.0%, a difference of 0.040%), Thai (74.0%, a difference of 0.040%), and Immigrants from Panama (73.9%, a difference of 0.060%).
| Demographics | Rating | Rank | In Labor Force | Age 20-24 |
| Bermudans | 3.2 /100 | #237 | Tragic 74.1% |
| Immigrants | Japan | 3.0 /100 | #238 | Tragic 74.1% |
| Immigrants | Latin America | 2.7 /100 | #239 | Tragic 74.1% |
| Immigrants | Sri Lanka | 2.3 /100 | #240 | Tragic 74.0% |
| Immigrants | Senegal | 2.1 /100 | #241 | Tragic 74.0% |
| Thais | 2.1 /100 | #242 | Tragic 74.0% |
| Immigrants | Syria | 1.9 /100 | #243 | Tragic 74.0% |
| Immigrants | South Central Asia | 1.9 /100 | #244 | Tragic 74.0% |
| Turks | 1.8 /100 | #245 | Tragic 73.9% |
| Immigrants | Panama | 1.6 /100 | #246 | Tragic 73.9% |
| Colville | 1.5 /100 | #247 | Tragic 73.9% |
| Immigrants | Saudi Arabia | 1.5 /100 | #248 | Tragic 73.9% |
| Blacks/African Americans | 1.3 /100 | #249 | Tragic 73.9% |
| Immigrants | Belgium | 1.3 /100 | #250 | Tragic 73.9% |
| Immigrants | Egypt | 1.2 /100 | #251 | Tragic 73.8% |