Yugoslavian vs Okinawan In Labor Force | Age 16-19
COMPARE
Yugoslavian
Okinawan
In Labor Force | Age 16-19
In Labor Force | Age 16-19 Comparison
Yugoslavians
Okinawans
41.8%
IN LABOR FORCE | AGE 16-19
100.0/ 100
METRIC RATING
35th/ 347
METRIC RANK
32.8%
IN LABOR FORCE | AGE 16-19
0.0/ 100
METRIC RATING
301st/ 347
METRIC RANK
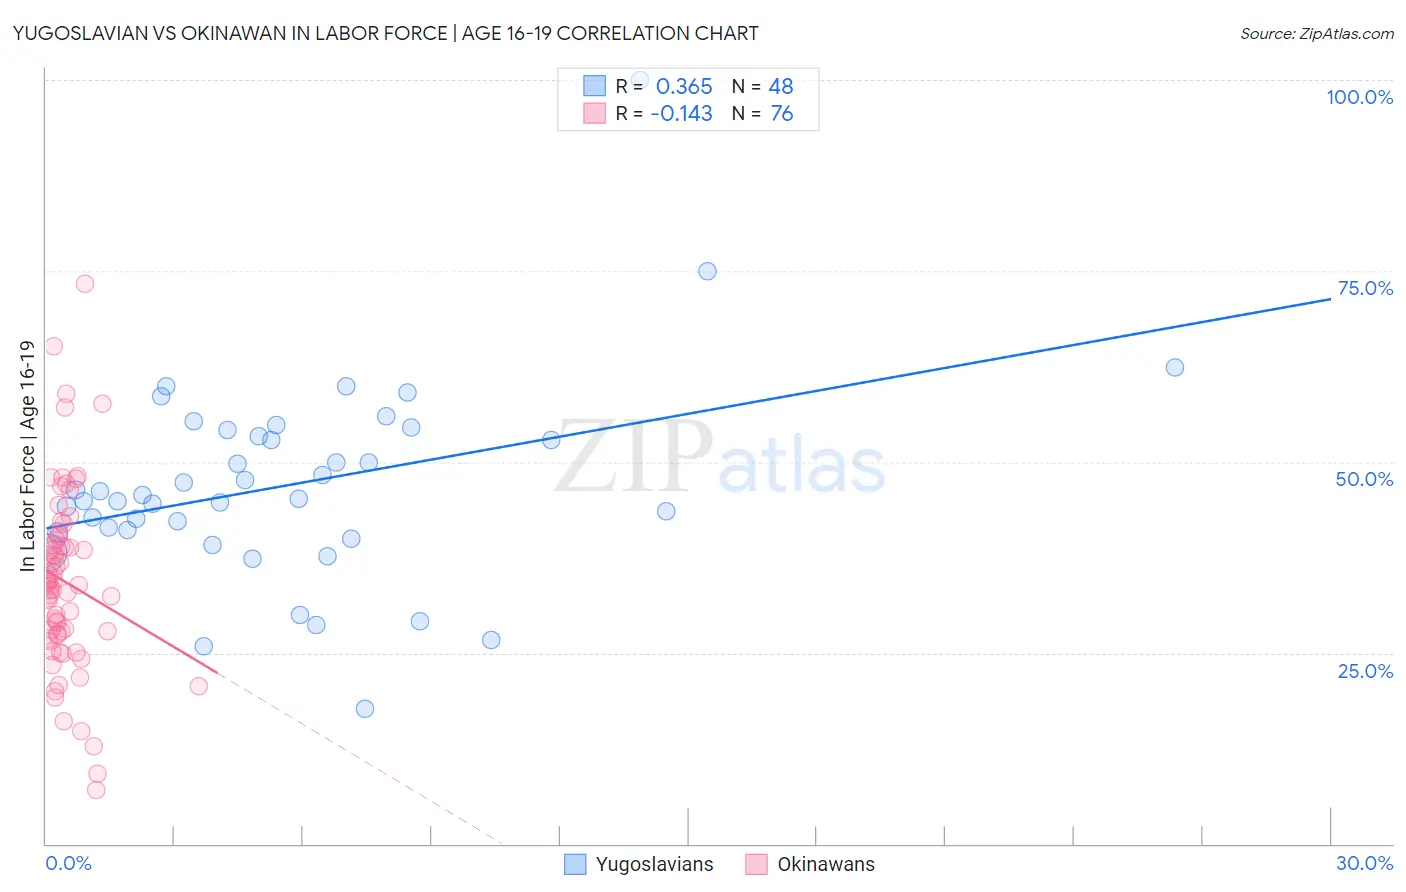
Yugoslavian vs Okinawan In Labor Force | Age 16-19 Correlation Chart
The statistical analysis conducted on geographies consisting of 285,420,048 people shows a mild positive correlation between the proportion of Yugoslavians and labor force participation rate among population between the ages 16 and 19 in the United States with a correlation coefficient (R) of 0.365 and weighted average of 41.8%. Similarly, the statistical analysis conducted on geographies consisting of 73,748,077 people shows a poor negative correlation between the proportion of Okinawans and labor force participation rate among population between the ages 16 and 19 in the United States with a correlation coefficient (R) of -0.143 and weighted average of 32.8%, a difference of 27.3%.
In Labor Force | Age 16-19 Correlation Summary
| Measurement | Yugoslavian | Okinawan |
| Minimum | 17.7% | 7.1% |
| Maximum | 100.0% | 73.4% |
| Range | 82.3% | 66.3% |
| Mean | 46.9% | 34.3% |
| Median | 45.4% | 33.9% |
| Interquartile 25% (IQ1) | 40.9% | 27.5% |
| Interquartile 75% (IQ3) | 53.8% | 39.4% |
| Interquartile Range (IQR) | 12.9% | 11.9% |
| Standard Deviation (Sample) | 13.2% | 11.8% |
| Standard Deviation (Population) | 13.0% | 11.8% |
Similar Demographics by In Labor Force | Age 16-19
Demographics Similar to Yugoslavians by In Labor Force | Age 16-19
In terms of in labor force | age 16-19, the demographic groups most similar to Yugoslavians are Immigrants from Bosnia and Herzegovina (41.8%, a difference of 0.020%), Liberian (41.8%, a difference of 0.10%), Immigrants from the Azores (41.7%, a difference of 0.14%), Immigrants from Congo (41.7%, a difference of 0.22%), and Czechoslovakian (41.9%, a difference of 0.24%).
| Demographics | Rating | Rank | In Labor Force | Age 16-19 |
| Poles | 100.0 /100 | #28 | Exceptional 42.1% |
| French | 100.0 /100 | #29 | Exceptional 42.1% |
| Scottish | 100.0 /100 | #30 | Exceptional 42.0% |
| Irish | 100.0 /100 | #31 | Exceptional 42.0% |
| Czechoslovakians | 100.0 /100 | #32 | Exceptional 41.9% |
| Liberians | 100.0 /100 | #33 | Exceptional 41.8% |
| Immigrants | Bosnia and Herzegovina | 100.0 /100 | #34 | Exceptional 41.8% |
| Yugoslavians | 100.0 /100 | #35 | Exceptional 41.8% |
| Immigrants | Azores | 100.0 /100 | #36 | Exceptional 41.7% |
| Immigrants | Congo | 100.0 /100 | #37 | Exceptional 41.7% |
| Sioux | 100.0 /100 | #38 | Exceptional 41.5% |
| Scotch-Irish | 100.0 /100 | #39 | Exceptional 41.5% |
| Immigrants | Liberia | 100.0 /100 | #40 | Exceptional 41.5% |
| Celtics | 100.0 /100 | #41 | Exceptional 41.3% |
| Whites/Caucasians | 100.0 /100 | #42 | Exceptional 41.3% |
Demographics Similar to Okinawans by In Labor Force | Age 16-19
In terms of in labor force | age 16-19, the demographic groups most similar to Okinawans are Belizean (32.8%, a difference of 0.14%), Immigrants from Argentina (32.9%, a difference of 0.24%), Armenian (32.9%, a difference of 0.39%), Iranian (33.0%, a difference of 0.63%), and Immigrants from Dominica (32.5%, a difference of 1.0%).
| Demographics | Rating | Rank | In Labor Force | Age 16-19 |
| Argentineans | 0.1 /100 | #294 | Tragic 33.3% |
| Yup'ik | 0.1 /100 | #295 | Tragic 33.3% |
| Jamaicans | 0.1 /100 | #296 | Tragic 33.2% |
| Immigrants | Haiti | 0.1 /100 | #297 | Tragic 33.2% |
| Iranians | 0.0 /100 | #298 | Tragic 33.0% |
| Armenians | 0.0 /100 | #299 | Tragic 32.9% |
| Immigrants | Argentina | 0.0 /100 | #300 | Tragic 32.9% |
| Okinawans | 0.0 /100 | #301 | Tragic 32.8% |
| Belizeans | 0.0 /100 | #302 | Tragic 32.8% |
| Immigrants | Dominica | 0.0 /100 | #303 | Tragic 32.5% |
| Israelis | 0.0 /100 | #304 | Tragic 32.4% |
| Nicaraguans | 0.0 /100 | #305 | Tragic 32.4% |
| Spanish American Indians | 0.0 /100 | #306 | Tragic 32.4% |
| Immigrants | Jamaica | 0.0 /100 | #307 | Tragic 32.2% |
| Navajo | 0.0 /100 | #308 | Tragic 32.1% |