Yaqui vs Korean In Labor Force | Age 35-44
COMPARE
Yaqui
Korean
In Labor Force | Age 35-44
In Labor Force | Age 35-44 Comparison
Yaqui
Koreans
80.5%
IN LABOR FORCE | AGE 35-44
0.0/ 100
METRIC RATING
323rd/ 347
METRIC RANK
84.3%
IN LABOR FORCE | AGE 35-44
36.3/ 100
METRIC RATING
182nd/ 347
METRIC RANK
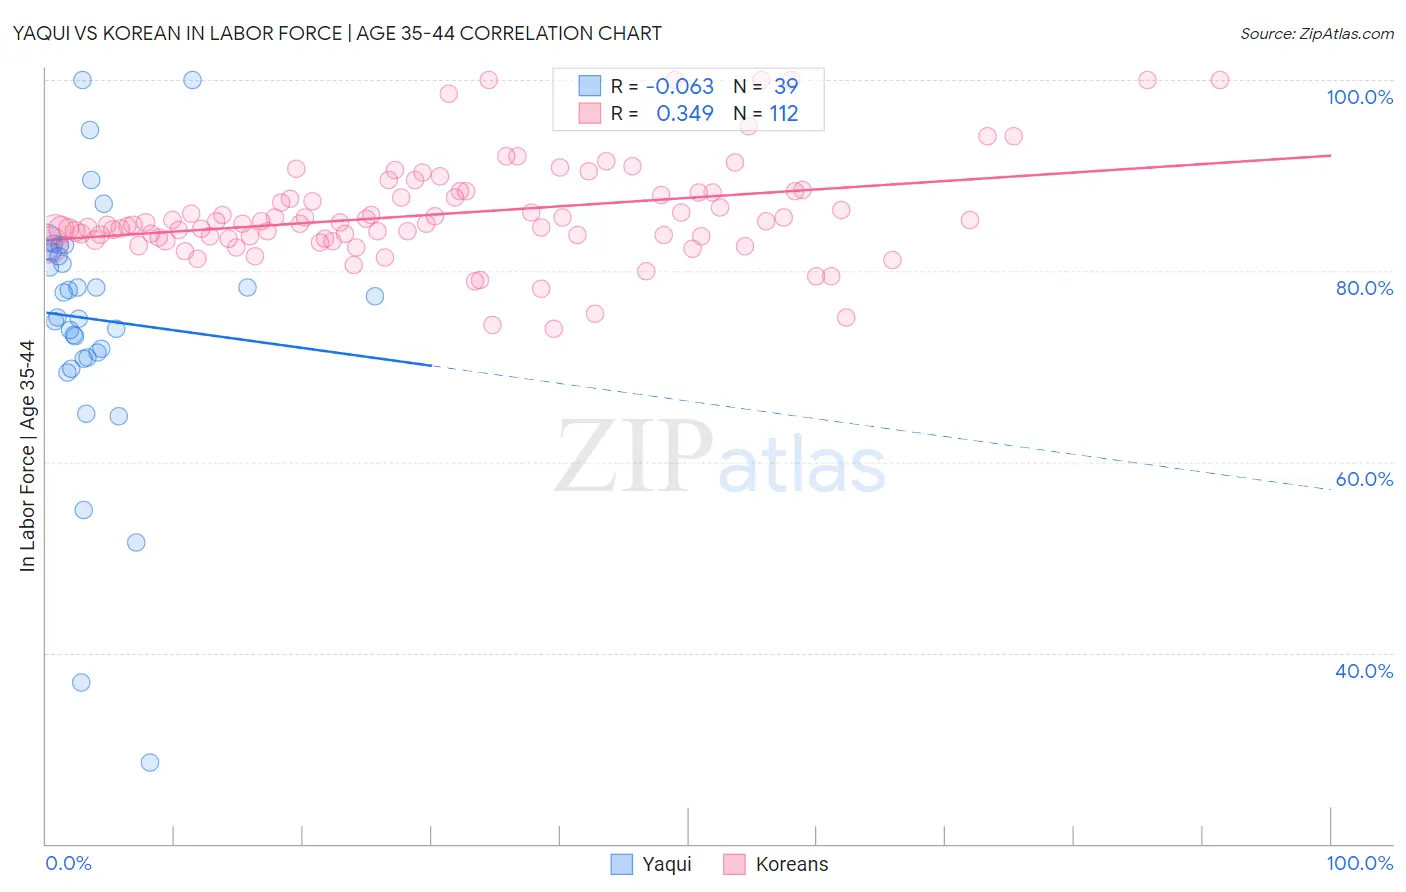
Yaqui vs Korean In Labor Force | Age 35-44 Correlation Chart
The statistical analysis conducted on geographies consisting of 107,720,131 people shows a slight negative correlation between the proportion of Yaqui and labor force participation rate among population between the ages 35 and 44 in the United States with a correlation coefficient (R) of -0.063 and weighted average of 80.5%. Similarly, the statistical analysis conducted on geographies consisting of 510,522,500 people shows a mild positive correlation between the proportion of Koreans and labor force participation rate among population between the ages 35 and 44 in the United States with a correlation coefficient (R) of 0.349 and weighted average of 84.3%, a difference of 4.7%.
In Labor Force | Age 35-44 Correlation Summary
| Measurement | Yaqui | Korean |
| Minimum | 28.5% | 74.0% |
| Maximum | 100.0% | 100.0% |
| Range | 71.5% | 26.0% |
| Mean | 74.9% | 86.0% |
| Median | 77.3% | 84.9% |
| Interquartile 25% (IQ1) | 70.9% | 83.4% |
| Interquartile 75% (IQ3) | 82.2% | 88.2% |
| Interquartile Range (IQR) | 11.3% | 4.8% |
| Standard Deviation (Sample) | 14.0% | 5.2% |
| Standard Deviation (Population) | 13.8% | 5.2% |
Similar Demographics by In Labor Force | Age 35-44
Demographics Similar to Yaqui by In Labor Force | Age 35-44
In terms of in labor force | age 35-44, the demographic groups most similar to Yaqui are Choctaw (80.5%, a difference of 0.010%), Paiute (80.6%, a difference of 0.11%), Dutch West Indian (80.4%, a difference of 0.16%), Puerto Rican (80.7%, a difference of 0.18%), and Seminole (80.4%, a difference of 0.20%).
| Demographics | Rating | Rank | In Labor Force | Age 35-44 |
| Comanche | 0.0 /100 | #316 | Tragic 81.5% |
| Cherokee | 0.0 /100 | #317 | Tragic 81.4% |
| Alaskan Athabascans | 0.0 /100 | #318 | Tragic 81.3% |
| Inupiat | 0.0 /100 | #319 | Tragic 80.9% |
| Chickasaw | 0.0 /100 | #320 | Tragic 80.9% |
| Puerto Ricans | 0.0 /100 | #321 | Tragic 80.7% |
| Paiute | 0.0 /100 | #322 | Tragic 80.6% |
| Yaqui | 0.0 /100 | #323 | Tragic 80.5% |
| Choctaw | 0.0 /100 | #324 | Tragic 80.5% |
| Dutch West Indians | 0.0 /100 | #325 | Tragic 80.4% |
| Seminole | 0.0 /100 | #326 | Tragic 80.4% |
| Sioux | 0.0 /100 | #327 | Tragic 80.2% |
| Creek | 0.0 /100 | #328 | Tragic 80.0% |
| Menominee | 0.0 /100 | #329 | Tragic 79.7% |
| Cheyenne | 0.0 /100 | #330 | Tragic 79.5% |
Demographics Similar to Koreans by In Labor Force | Age 35-44
In terms of in labor force | age 35-44, the demographic groups most similar to Koreans are Immigrants from West Indies (84.3%, a difference of 0.0%), Barbadian (84.3%, a difference of 0.0%), Armenian (84.3%, a difference of 0.010%), Costa Rican (84.3%, a difference of 0.010%), and Australian (84.3%, a difference of 0.010%).
| Demographics | Rating | Rank | In Labor Force | Age 35-44 |
| Pakistanis | 48.2 /100 | #175 | Average 84.4% |
| Sri Lankans | 47.3 /100 | #176 | Average 84.4% |
| French Canadians | 44.3 /100 | #177 | Average 84.3% |
| Northern Europeans | 44.1 /100 | #178 | Average 84.3% |
| Immigrants | South Africa | 42.8 /100 | #179 | Average 84.3% |
| Danes | 38.8 /100 | #180 | Fair 84.3% |
| Immigrants | West Indies | 36.4 /100 | #181 | Fair 84.3% |
| Koreans | 36.3 /100 | #182 | Fair 84.3% |
| Barbadians | 36.2 /100 | #183 | Fair 84.3% |
| Armenians | 35.6 /100 | #184 | Fair 84.3% |
| Costa Ricans | 35.3 /100 | #185 | Fair 84.3% |
| Australians | 35.1 /100 | #186 | Fair 84.3% |
| Dutch | 34.8 /100 | #187 | Fair 84.3% |
| South Africans | 34.1 /100 | #188 | Fair 84.3% |
| Immigrants | Denmark | 33.7 /100 | #189 | Fair 84.3% |