Yakama vs Native Hawaiian In Labor Force | Age 20-64
COMPARE
Yakama
Native Hawaiian
In Labor Force | Age 20-64
In Labor Force | Age 20-64 Comparison
Yakama
Native Hawaiians
75.8%
IN LABOR FORCE | AGE 20-64
0.0/ 100
METRIC RATING
320th/ 347
METRIC RANK
79.1%
IN LABOR FORCE | AGE 20-64
5.6/ 100
METRIC RATING
230th/ 347
METRIC RANK
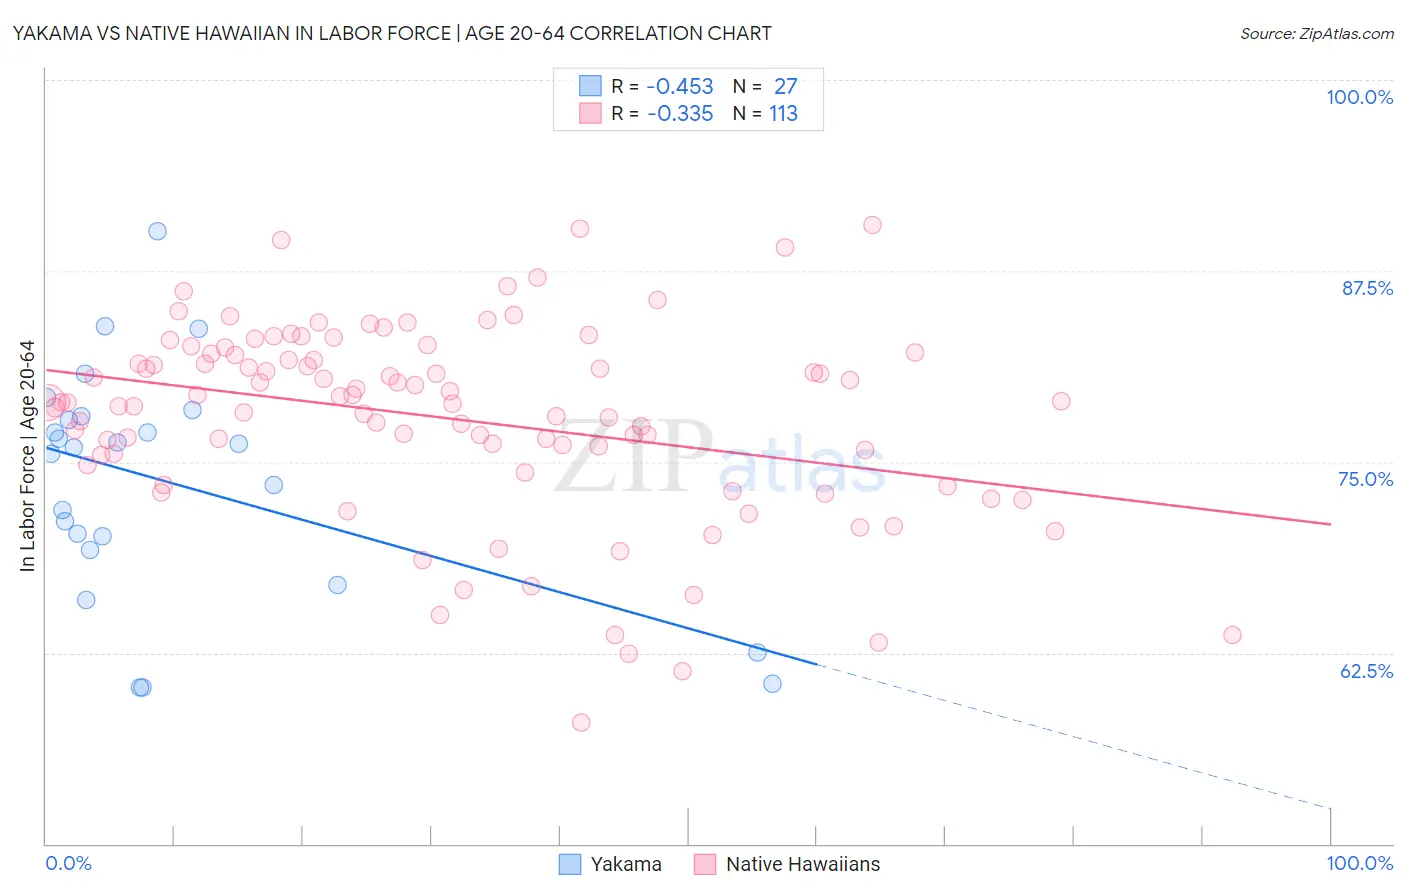
Yakama vs Native Hawaiian In Labor Force | Age 20-64 Correlation Chart
The statistical analysis conducted on geographies consisting of 19,917,879 people shows a moderate negative correlation between the proportion of Yakama and labor force participation rate among population between the ages 20 and 64 in the United States with a correlation coefficient (R) of -0.453 and weighted average of 75.8%. Similarly, the statistical analysis conducted on geographies consisting of 332,116,366 people shows a mild negative correlation between the proportion of Native Hawaiians and labor force participation rate among population between the ages 20 and 64 in the United States with a correlation coefficient (R) of -0.335 and weighted average of 79.1%, a difference of 4.4%.
In Labor Force | Age 20-64 Correlation Summary
| Measurement | Yakama | Native Hawaiian |
| Minimum | 60.2% | 57.9% |
| Maximum | 90.1% | 90.5% |
| Range | 29.9% | 32.6% |
| Mean | 73.6% | 77.9% |
| Median | 75.9% | 78.9% |
| Interquartile 25% (IQ1) | 69.2% | 75.1% |
| Interquartile 75% (IQ3) | 78.0% | 82.0% |
| Interquartile Range (IQR) | 8.8% | 6.9% |
| Standard Deviation (Sample) | 7.6% | 6.4% |
| Standard Deviation (Population) | 7.4% | 6.3% |
Similar Demographics by In Labor Force | Age 20-64
Demographics Similar to Yakama by In Labor Force | Age 20-64
In terms of in labor force | age 20-64, the demographic groups most similar to Yakama are Seminole (75.5%, a difference of 0.35%), Inupiat (76.1%, a difference of 0.38%), Dutch West Indian (75.5%, a difference of 0.40%), Cajun (75.5%, a difference of 0.44%), and Choctaw (75.4%, a difference of 0.50%).
| Demographics | Rating | Rank | In Labor Force | Age 20-64 |
| Shoshone | 0.0 /100 | #313 | Tragic 76.8% |
| Blacks/African Americans | 0.0 /100 | #314 | Tragic 76.8% |
| Ottawa | 0.0 /100 | #315 | Tragic 76.7% |
| Yaqui | 0.0 /100 | #316 | Tragic 76.5% |
| Cherokee | 0.0 /100 | #317 | Tragic 76.2% |
| Chickasaw | 0.0 /100 | #318 | Tragic 76.2% |
| Inupiat | 0.0 /100 | #319 | Tragic 76.1% |
| Yakama | 0.0 /100 | #320 | Tragic 75.8% |
| Seminole | 0.0 /100 | #321 | Tragic 75.5% |
| Dutch West Indians | 0.0 /100 | #322 | Tragic 75.5% |
| Cajuns | 0.0 /100 | #323 | Tragic 75.5% |
| Choctaw | 0.0 /100 | #324 | Tragic 75.4% |
| Menominee | 0.0 /100 | #325 | Tragic 75.3% |
| Creek | 0.0 /100 | #326 | Tragic 75.1% |
| Sioux | 0.0 /100 | #327 | Tragic 75.0% |
Demographics Similar to Native Hawaiians by In Labor Force | Age 20-64
In terms of in labor force | age 20-64, the demographic groups most similar to Native Hawaiians are Panamanian (79.1%, a difference of 0.0%), Alsatian (79.1%, a difference of 0.0%), Central American (79.1%, a difference of 0.010%), Immigrants from Western Europe (79.1%, a difference of 0.010%), and Lebanese (79.1%, a difference of 0.020%).
| Demographics | Rating | Rank | In Labor Force | Age 20-64 |
| Canadians | 6.8 /100 | #223 | Tragic 79.1% |
| Immigrants | Uzbekistan | 6.8 /100 | #224 | Tragic 79.1% |
| Portuguese | 6.4 /100 | #225 | Tragic 79.1% |
| Central Americans | 5.9 /100 | #226 | Tragic 79.1% |
| Immigrants | Western Europe | 5.9 /100 | #227 | Tragic 79.1% |
| Panamanians | 5.7 /100 | #228 | Tragic 79.1% |
| Alsatians | 5.7 /100 | #229 | Tragic 79.1% |
| Native Hawaiians | 5.6 /100 | #230 | Tragic 79.1% |
| Lebanese | 5.1 /100 | #231 | Tragic 79.1% |
| Guamanians/Chamorros | 4.5 /100 | #232 | Tragic 79.1% |
| Japanese | 4.0 /100 | #233 | Tragic 79.1% |
| Immigrants | Canada | 3.2 /100 | #234 | Tragic 79.0% |
| Tlingit-Haida | 3.2 /100 | #235 | Tragic 79.0% |
| Samoans | 2.9 /100 | #236 | Tragic 79.0% |
| Immigrants | North America | 2.9 /100 | #237 | Tragic 79.0% |