Yakama vs Immigrants from Vietnam In Labor Force | Age 20-24
COMPARE
Yakama
Immigrants from Vietnam
In Labor Force | Age 20-24
In Labor Force | Age 20-24 Comparison
Yakama
Immigrants from Vietnam
75.1%
IN LABOR FORCE | AGE 20-24
50.8/ 100
METRIC RATING
172nd/ 347
METRIC RANK
74.7%
IN LABOR FORCE | AGE 20-24
25.1/ 100
METRIC RATING
196th/ 347
METRIC RANK
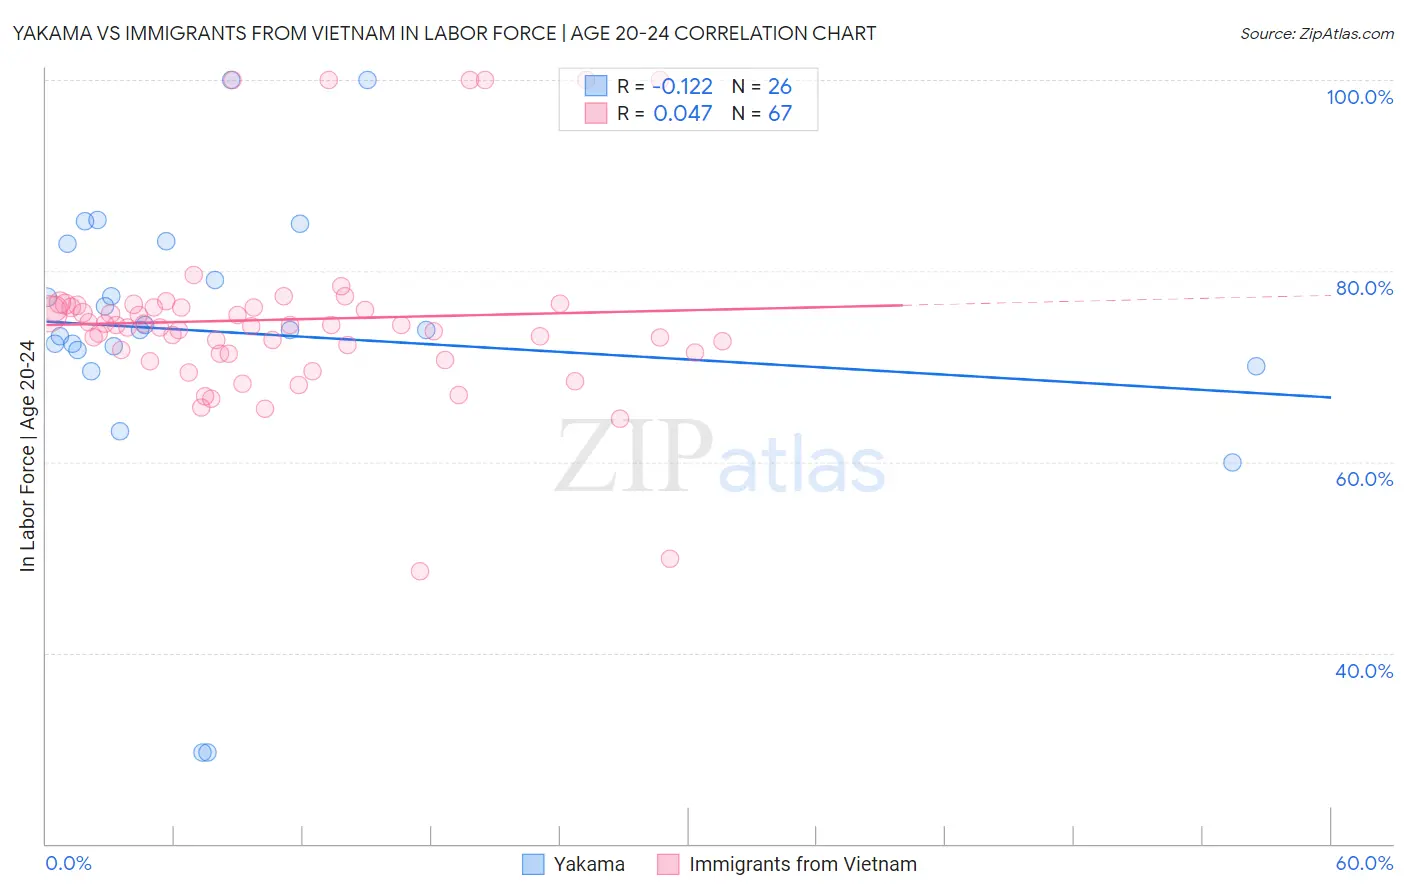
Yakama vs Immigrants from Vietnam In Labor Force | Age 20-24 Correlation Chart
The statistical analysis conducted on geographies consisting of 19,914,894 people shows a poor negative correlation between the proportion of Yakama and labor force participation rate among population between the ages 20 and 24 in the United States with a correlation coefficient (R) of -0.122 and weighted average of 75.1%. Similarly, the statistical analysis conducted on geographies consisting of 404,738,043 people shows no correlation between the proportion of Immigrants from Vietnam and labor force participation rate among population between the ages 20 and 24 in the United States with a correlation coefficient (R) of 0.047 and weighted average of 74.7%, a difference of 0.41%.
In Labor Force | Age 20-24 Correlation Summary
| Measurement | Yakama | Immigrants from Vietnam |
| Minimum | 29.6% | 48.6% |
| Maximum | 100.0% | 100.0% |
| Range | 70.4% | 51.4% |
| Mean | 73.5% | 74.9% |
| Median | 73.8% | 74.3% |
| Interquartile 25% (IQ1) | 71.8% | 71.4% |
| Interquartile 75% (IQ3) | 82.9% | 76.2% |
| Interquartile Range (IQR) | 11.1% | 4.8% |
| Standard Deviation (Sample) | 15.8% | 9.5% |
| Standard Deviation (Population) | 15.5% | 9.4% |
Similar Demographics by In Labor Force | Age 20-24
Demographics Similar to Yakama by In Labor Force | Age 20-24
In terms of in labor force | age 20-24, the demographic groups most similar to Yakama are Cajun (75.1%, a difference of 0.010%), Immigrants from Croatia (75.1%, a difference of 0.010%), South African (75.0%, a difference of 0.010%), Mexican (75.1%, a difference of 0.020%), and Syrian (75.0%, a difference of 0.020%).
| Demographics | Rating | Rank | In Labor Force | Age 20-24 |
| Afghans | 63.5 /100 | #165 | Good 75.2% |
| Cambodians | 60.5 /100 | #166 | Good 75.2% |
| Immigrants | South Eastern Asia | 57.5 /100 | #167 | Average 75.1% |
| Immigrants | Western Africa | 56.7 /100 | #168 | Average 75.1% |
| Immigrants | Philippines | 55.8 /100 | #169 | Average 75.1% |
| Mexicans | 52.1 /100 | #170 | Average 75.1% |
| Cajuns | 51.1 /100 | #171 | Average 75.1% |
| Yakama | 50.8 /100 | #172 | Average 75.1% |
| Immigrants | Croatia | 50.2 /100 | #173 | Average 75.1% |
| South Africans | 50.0 /100 | #174 | Average 75.0% |
| Syrians | 49.5 /100 | #175 | Average 75.0% |
| Central Americans | 48.7 /100 | #176 | Average 75.0% |
| Immigrants | Mexico | 47.8 /100 | #177 | Average 75.0% |
| Immigrants | Central America | 45.0 /100 | #178 | Average 75.0% |
| Immigrants | Latvia | 44.1 /100 | #179 | Average 75.0% |
Demographics Similar to Immigrants from Vietnam by In Labor Force | Age 20-24
In terms of in labor force | age 20-24, the demographic groups most similar to Immigrants from Vietnam are Panamanian (74.7%, a difference of 0.0%), Immigrants from Denmark (74.8%, a difference of 0.010%), Eastern European (74.8%, a difference of 0.010%), Immigrants from Nigeria (74.7%, a difference of 0.020%), and Alsatian (74.8%, a difference of 0.040%).
| Demographics | Rating | Rank | In Labor Force | Age 20-24 |
| Immigrants | Northern Europe | 32.6 /100 | #189 | Fair 74.8% |
| Russians | 32.2 /100 | #190 | Fair 74.8% |
| Senegalese | 28.1 /100 | #191 | Fair 74.8% |
| Immigrants | Europe | 27.5 /100 | #192 | Fair 74.8% |
| Alsatians | 27.1 /100 | #193 | Fair 74.8% |
| Immigrants | Denmark | 25.8 /100 | #194 | Fair 74.8% |
| Eastern Europeans | 25.4 /100 | #195 | Fair 74.8% |
| Immigrants | Vietnam | 25.1 /100 | #196 | Fair 74.7% |
| Panamanians | 25.0 /100 | #197 | Fair 74.7% |
| Immigrants | Nigeria | 24.2 /100 | #198 | Fair 74.7% |
| Taiwanese | 23.2 /100 | #199 | Fair 74.7% |
| Nigerians | 21.9 /100 | #200 | Fair 74.7% |
| Choctaw | 21.4 /100 | #201 | Fair 74.7% |
| Moroccans | 20.4 /100 | #202 | Fair 74.7% |
| Immigrants | Northern Africa | 17.9 /100 | #203 | Poor 74.6% |