Immigrants from Congo vs Immigrants from Vietnam In Labor Force | Age 20-24
COMPARE
Immigrants from Congo
Immigrants from Vietnam
In Labor Force | Age 20-24
In Labor Force | Age 20-24 Comparison
Immigrants from Congo
Immigrants from Vietnam
77.4%
IN LABOR FORCE | AGE 20-24
100.0/ 100
METRIC RATING
41st/ 347
METRIC RANK
74.7%
IN LABOR FORCE | AGE 20-24
25.1/ 100
METRIC RATING
196th/ 347
METRIC RANK
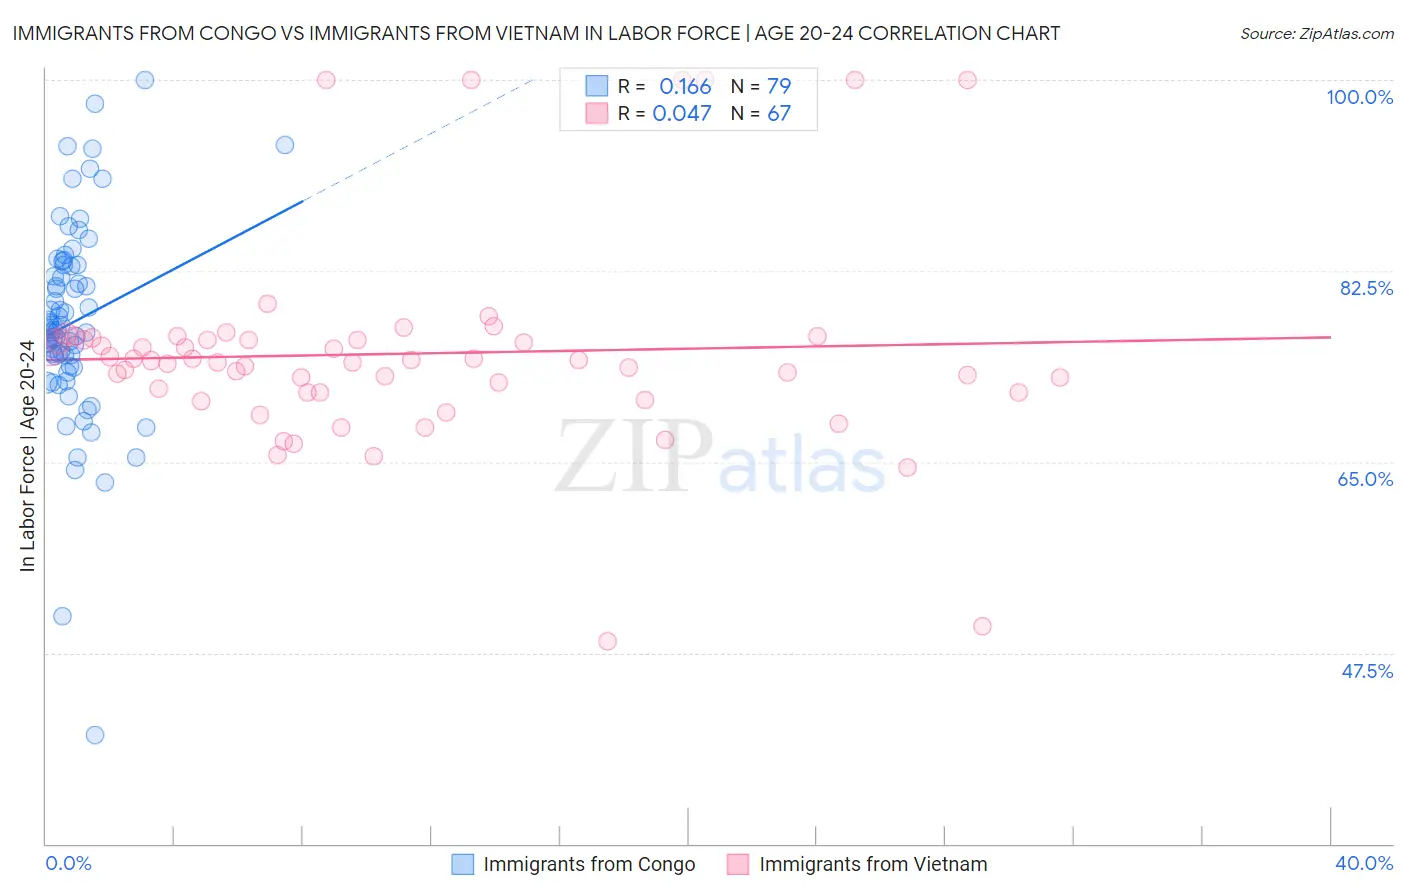
Immigrants from Congo vs Immigrants from Vietnam In Labor Force | Age 20-24 Correlation Chart
The statistical analysis conducted on geographies consisting of 92,127,534 people shows a poor positive correlation between the proportion of Immigrants from Congo and labor force participation rate among population between the ages 20 and 24 in the United States with a correlation coefficient (R) of 0.166 and weighted average of 77.4%. Similarly, the statistical analysis conducted on geographies consisting of 404,738,043 people shows no correlation between the proportion of Immigrants from Vietnam and labor force participation rate among population between the ages 20 and 24 in the United States with a correlation coefficient (R) of 0.047 and weighted average of 74.7%, a difference of 3.5%.
In Labor Force | Age 20-24 Correlation Summary
| Measurement | Immigrants from Congo | Immigrants from Vietnam |
| Minimum | 40.0% | 48.6% |
| Maximum | 100.0% | 100.0% |
| Range | 60.0% | 51.4% |
| Mean | 77.8% | 74.9% |
| Median | 77.1% | 74.3% |
| Interquartile 25% (IQ1) | 73.8% | 71.4% |
| Interquartile 75% (IQ3) | 83.0% | 76.2% |
| Interquartile Range (IQR) | 9.2% | 4.8% |
| Standard Deviation (Sample) | 9.2% | 9.5% |
| Standard Deviation (Population) | 9.2% | 9.4% |
Similar Demographics by In Labor Force | Age 20-24
Demographics Similar to Immigrants from Congo by In Labor Force | Age 20-24
In terms of in labor force | age 20-24, the demographic groups most similar to Immigrants from Congo are Scottish (77.4%, a difference of 0.010%), French (77.4%, a difference of 0.010%), Immigrants from Laos (77.4%, a difference of 0.020%), Fijian (77.4%, a difference of 0.030%), and Irish (77.4%, a difference of 0.040%).
| Demographics | Rating | Rank | In Labor Force | Age 20-24 |
| German Russians | 100.0 /100 | #34 | Exceptional 77.5% |
| Immigrants | Eastern Africa | 100.0 /100 | #35 | Exceptional 77.5% |
| Welsh | 100.0 /100 | #36 | Exceptional 77.5% |
| Czechoslovakians | 100.0 /100 | #37 | Exceptional 77.5% |
| Marshallese | 100.0 /100 | #38 | Exceptional 77.4% |
| Irish | 100.0 /100 | #39 | Exceptional 77.4% |
| Scottish | 100.0 /100 | #40 | Exceptional 77.4% |
| Immigrants | Congo | 100.0 /100 | #41 | Exceptional 77.4% |
| French | 100.0 /100 | #42 | Exceptional 77.4% |
| Immigrants | Laos | 100.0 /100 | #43 | Exceptional 77.4% |
| Fijians | 100.0 /100 | #44 | Exceptional 77.4% |
| Native Hawaiians | 100.0 /100 | #45 | Exceptional 77.4% |
| Samoans | 100.0 /100 | #46 | Exceptional 77.4% |
| Ethiopians | 100.0 /100 | #47 | Exceptional 77.3% |
| Serbians | 100.0 /100 | #48 | Exceptional 77.3% |
Demographics Similar to Immigrants from Vietnam by In Labor Force | Age 20-24
In terms of in labor force | age 20-24, the demographic groups most similar to Immigrants from Vietnam are Panamanian (74.7%, a difference of 0.0%), Immigrants from Denmark (74.8%, a difference of 0.010%), Eastern European (74.8%, a difference of 0.010%), Immigrants from Nigeria (74.7%, a difference of 0.020%), and Alsatian (74.8%, a difference of 0.040%).
| Demographics | Rating | Rank | In Labor Force | Age 20-24 |
| Immigrants | Northern Europe | 32.6 /100 | #189 | Fair 74.8% |
| Russians | 32.2 /100 | #190 | Fair 74.8% |
| Senegalese | 28.1 /100 | #191 | Fair 74.8% |
| Immigrants | Europe | 27.5 /100 | #192 | Fair 74.8% |
| Alsatians | 27.1 /100 | #193 | Fair 74.8% |
| Immigrants | Denmark | 25.8 /100 | #194 | Fair 74.8% |
| Eastern Europeans | 25.4 /100 | #195 | Fair 74.8% |
| Immigrants | Vietnam | 25.1 /100 | #196 | Fair 74.7% |
| Panamanians | 25.0 /100 | #197 | Fair 74.7% |
| Immigrants | Nigeria | 24.2 /100 | #198 | Fair 74.7% |
| Taiwanese | 23.2 /100 | #199 | Fair 74.7% |
| Nigerians | 21.9 /100 | #200 | Fair 74.7% |
| Choctaw | 21.4 /100 | #201 | Fair 74.7% |
| Moroccans | 20.4 /100 | #202 | Fair 74.7% |
| Immigrants | Northern Africa | 17.9 /100 | #203 | Poor 74.6% |