Yakama vs Immigrants from Congo In Labor Force | Age 20-24
COMPARE
Yakama
Immigrants from Congo
In Labor Force | Age 20-24
In Labor Force | Age 20-24 Comparison
Yakama
Immigrants from Congo
75.1%
IN LABOR FORCE | AGE 20-24
50.8/ 100
METRIC RATING
172nd/ 347
METRIC RANK
77.4%
IN LABOR FORCE | AGE 20-24
100.0/ 100
METRIC RATING
41st/ 347
METRIC RANK
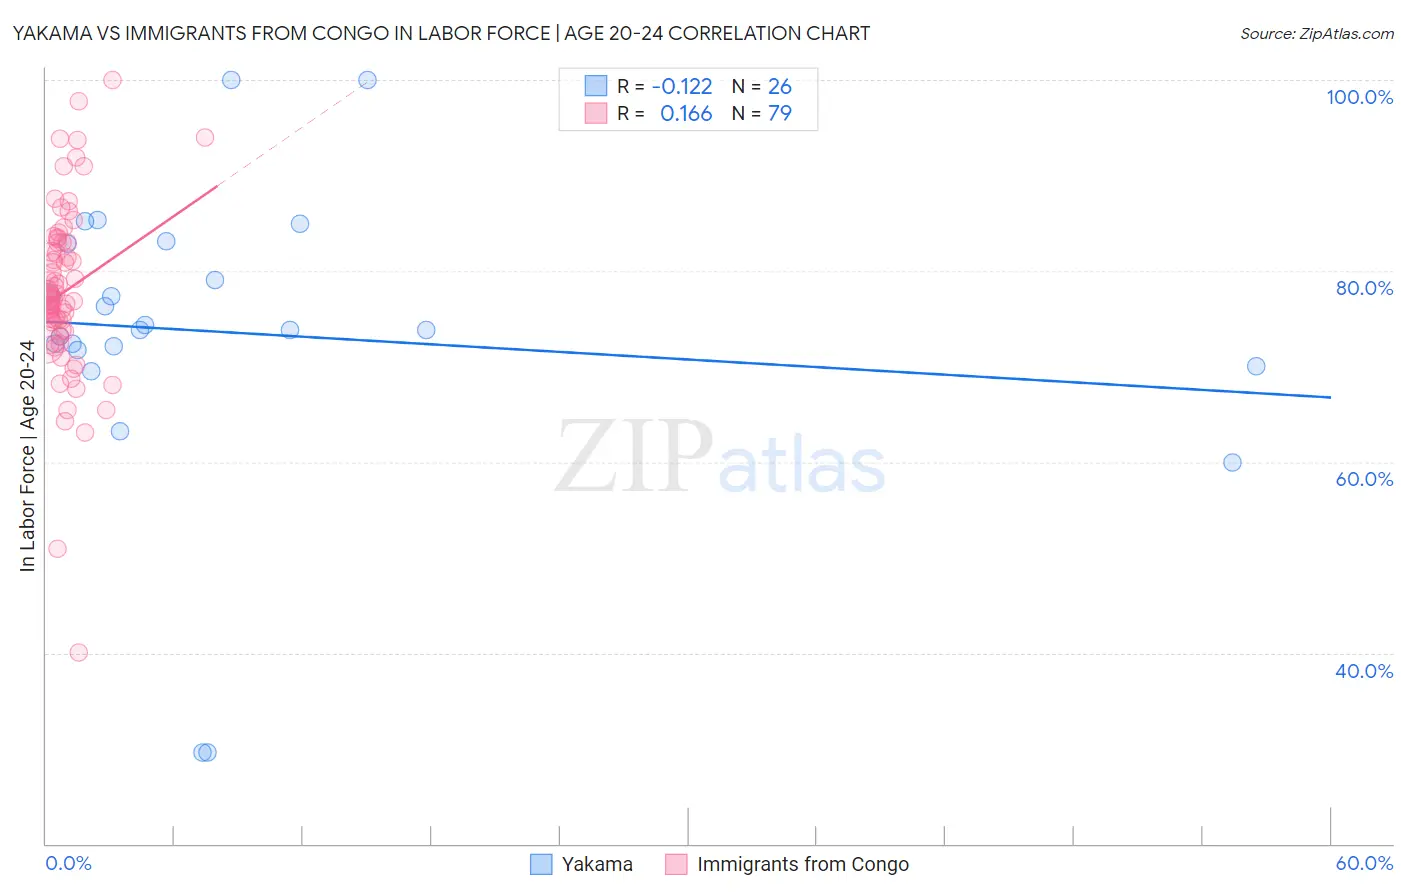
Yakama vs Immigrants from Congo In Labor Force | Age 20-24 Correlation Chart
The statistical analysis conducted on geographies consisting of 19,914,894 people shows a poor negative correlation between the proportion of Yakama and labor force participation rate among population between the ages 20 and 24 in the United States with a correlation coefficient (R) of -0.122 and weighted average of 75.1%. Similarly, the statistical analysis conducted on geographies consisting of 92,127,534 people shows a poor positive correlation between the proportion of Immigrants from Congo and labor force participation rate among population between the ages 20 and 24 in the United States with a correlation coefficient (R) of 0.166 and weighted average of 77.4%, a difference of 3.1%.
In Labor Force | Age 20-24 Correlation Summary
| Measurement | Yakama | Immigrants from Congo |
| Minimum | 29.6% | 40.0% |
| Maximum | 100.0% | 100.0% |
| Range | 70.4% | 60.0% |
| Mean | 73.5% | 77.8% |
| Median | 73.8% | 77.1% |
| Interquartile 25% (IQ1) | 71.8% | 73.8% |
| Interquartile 75% (IQ3) | 82.9% | 83.0% |
| Interquartile Range (IQR) | 11.1% | 9.2% |
| Standard Deviation (Sample) | 15.8% | 9.2% |
| Standard Deviation (Population) | 15.5% | 9.2% |
Similar Demographics by In Labor Force | Age 20-24
Demographics Similar to Yakama by In Labor Force | Age 20-24
In terms of in labor force | age 20-24, the demographic groups most similar to Yakama are Cajun (75.1%, a difference of 0.010%), Immigrants from Croatia (75.1%, a difference of 0.010%), South African (75.0%, a difference of 0.010%), Mexican (75.1%, a difference of 0.020%), and Syrian (75.0%, a difference of 0.020%).
| Demographics | Rating | Rank | In Labor Force | Age 20-24 |
| Afghans | 63.5 /100 | #165 | Good 75.2% |
| Cambodians | 60.5 /100 | #166 | Good 75.2% |
| Immigrants | South Eastern Asia | 57.5 /100 | #167 | Average 75.1% |
| Immigrants | Western Africa | 56.7 /100 | #168 | Average 75.1% |
| Immigrants | Philippines | 55.8 /100 | #169 | Average 75.1% |
| Mexicans | 52.1 /100 | #170 | Average 75.1% |
| Cajuns | 51.1 /100 | #171 | Average 75.1% |
| Yakama | 50.8 /100 | #172 | Average 75.1% |
| Immigrants | Croatia | 50.2 /100 | #173 | Average 75.1% |
| South Africans | 50.0 /100 | #174 | Average 75.0% |
| Syrians | 49.5 /100 | #175 | Average 75.0% |
| Central Americans | 48.7 /100 | #176 | Average 75.0% |
| Immigrants | Mexico | 47.8 /100 | #177 | Average 75.0% |
| Immigrants | Central America | 45.0 /100 | #178 | Average 75.0% |
| Immigrants | Latvia | 44.1 /100 | #179 | Average 75.0% |
Demographics Similar to Immigrants from Congo by In Labor Force | Age 20-24
In terms of in labor force | age 20-24, the demographic groups most similar to Immigrants from Congo are Scottish (77.4%, a difference of 0.010%), French (77.4%, a difference of 0.010%), Immigrants from Laos (77.4%, a difference of 0.020%), Fijian (77.4%, a difference of 0.030%), and Irish (77.4%, a difference of 0.040%).
| Demographics | Rating | Rank | In Labor Force | Age 20-24 |
| German Russians | 100.0 /100 | #34 | Exceptional 77.5% |
| Immigrants | Eastern Africa | 100.0 /100 | #35 | Exceptional 77.5% |
| Welsh | 100.0 /100 | #36 | Exceptional 77.5% |
| Czechoslovakians | 100.0 /100 | #37 | Exceptional 77.5% |
| Marshallese | 100.0 /100 | #38 | Exceptional 77.4% |
| Irish | 100.0 /100 | #39 | Exceptional 77.4% |
| Scottish | 100.0 /100 | #40 | Exceptional 77.4% |
| Immigrants | Congo | 100.0 /100 | #41 | Exceptional 77.4% |
| French | 100.0 /100 | #42 | Exceptional 77.4% |
| Immigrants | Laos | 100.0 /100 | #43 | Exceptional 77.4% |
| Fijians | 100.0 /100 | #44 | Exceptional 77.4% |
| Native Hawaiians | 100.0 /100 | #45 | Exceptional 77.4% |
| Samoans | 100.0 /100 | #46 | Exceptional 77.4% |
| Ethiopians | 100.0 /100 | #47 | Exceptional 77.3% |
| Serbians | 100.0 /100 | #48 | Exceptional 77.3% |