White/Caucasian vs Sri Lankan In Labor Force | Age 45-54
COMPARE
White/Caucasian
Sri Lankan
In Labor Force | Age 45-54
In Labor Force | Age 45-54 Comparison
Whites/Caucasians
Sri Lankans
81.9%
IN LABOR FORCE | AGE 45-54
0.7/ 100
METRIC RATING
242nd/ 347
METRIC RANK
83.2%
IN LABOR FORCE | AGE 45-54
93.2/ 100
METRIC RATING
106th/ 347
METRIC RANK
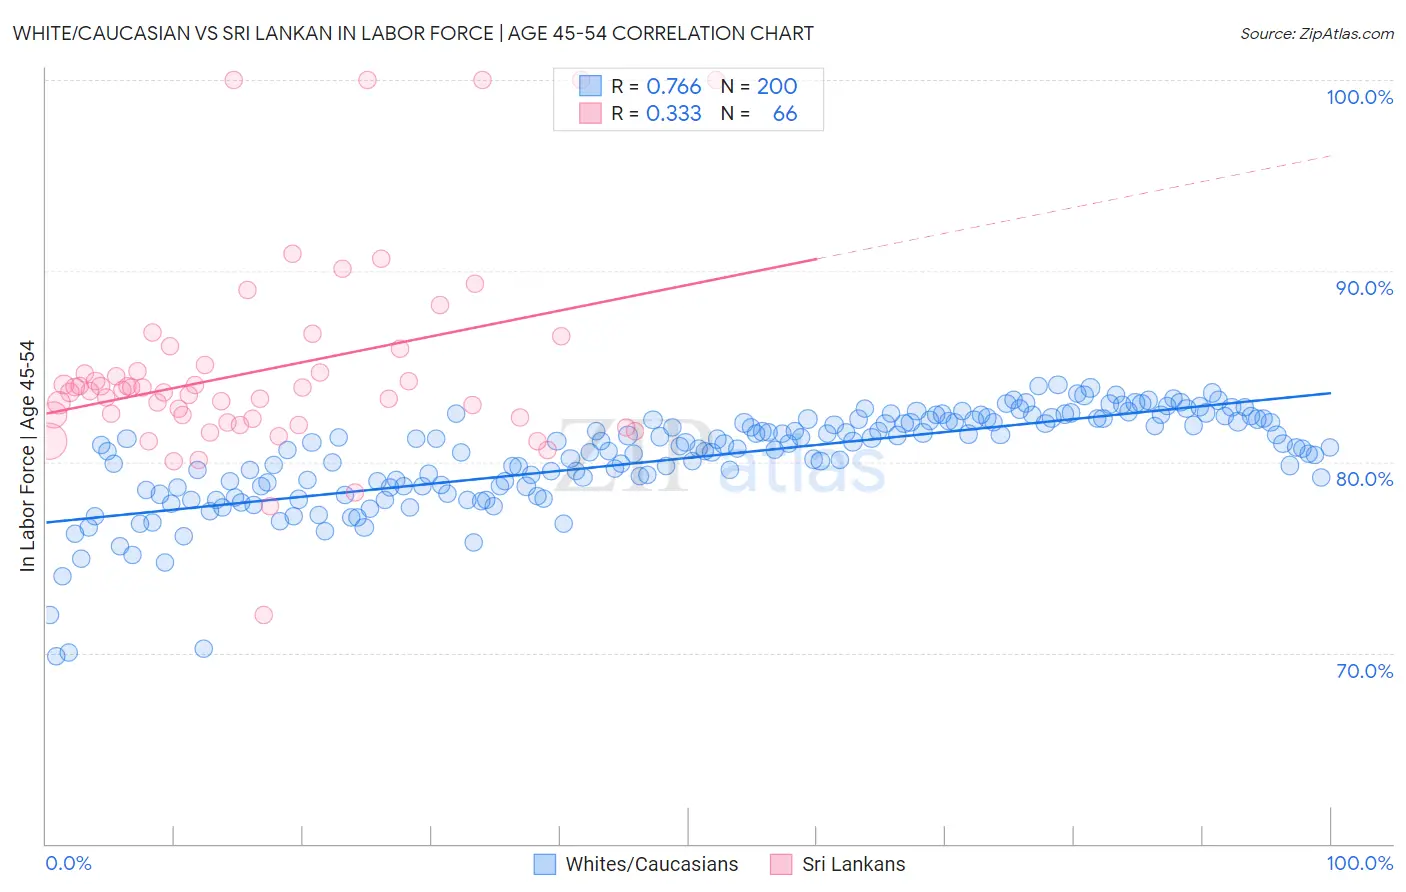
White/Caucasian vs Sri Lankan In Labor Force | Age 45-54 Correlation Chart
The statistical analysis conducted on geographies consisting of 583,949,283 people shows a strong positive correlation between the proportion of Whites/Caucasians and labor force participation rate among population between the ages 45 and 54 in the United States with a correlation coefficient (R) of 0.766 and weighted average of 81.9%. Similarly, the statistical analysis conducted on geographies consisting of 440,078,973 people shows a mild positive correlation between the proportion of Sri Lankans and labor force participation rate among population between the ages 45 and 54 in the United States with a correlation coefficient (R) of 0.333 and weighted average of 83.2%, a difference of 1.7%.
In Labor Force | Age 45-54 Correlation Summary
| Measurement | White/Caucasian | Sri Lankan |
| Minimum | 69.8% | 72.0% |
| Maximum | 84.0% | 100.0% |
| Range | 14.2% | 28.0% |
| Mean | 80.2% | 84.8% |
| Median | 80.8% | 83.7% |
| Interquartile 25% (IQ1) | 78.7% | 82.2% |
| Interquartile 75% (IQ3) | 82.2% | 85.1% |
| Interquartile Range (IQR) | 3.4% | 2.8% |
| Standard Deviation (Sample) | 2.6% | 5.3% |
| Standard Deviation (Population) | 2.6% | 5.2% |
Similar Demographics by In Labor Force | Age 45-54
Demographics Similar to Whites/Caucasians by In Labor Force | Age 45-54
In terms of in labor force | age 45-54, the demographic groups most similar to Whites/Caucasians are Samoan (81.8%, a difference of 0.010%), Immigrants from Cambodia (81.9%, a difference of 0.040%), Immigrants from Thailand (81.9%, a difference of 0.090%), Immigrants from El Salvador (81.9%, a difference of 0.090%), and Celtic (81.8%, a difference of 0.10%).
| Demographics | Rating | Rank | In Labor Force | Age 45-54 |
| Sub-Saharan Africans | 1.2 /100 | #235 | Tragic 82.0% |
| Basques | 1.2 /100 | #236 | Tragic 82.0% |
| Immigrants | Trinidad and Tobago | 1.2 /100 | #237 | Tragic 82.0% |
| Trinidadians and Tobagonians | 1.1 /100 | #238 | Tragic 81.9% |
| Immigrants | Thailand | 1.0 /100 | #239 | Tragic 81.9% |
| Immigrants | El Salvador | 1.0 /100 | #240 | Tragic 81.9% |
| Immigrants | Cambodia | 0.8 /100 | #241 | Tragic 81.9% |
| Whites/Caucasians | 0.7 /100 | #242 | Tragic 81.9% |
| Samoans | 0.6 /100 | #243 | Tragic 81.8% |
| Celtics | 0.4 /100 | #244 | Tragic 81.8% |
| Alaska Natives | 0.4 /100 | #245 | Tragic 81.8% |
| Alaskan Athabascans | 0.4 /100 | #246 | Tragic 81.8% |
| Central Americans | 0.4 /100 | #247 | Tragic 81.7% |
| Puget Sound Salish | 0.3 /100 | #248 | Tragic 81.7% |
| Hmong | 0.3 /100 | #249 | Tragic 81.7% |
Demographics Similar to Sri Lankans by In Labor Force | Age 45-54
In terms of in labor force | age 45-54, the demographic groups most similar to Sri Lankans are Immigrants from South America (83.2%, a difference of 0.010%), Iranian (83.2%, a difference of 0.010%), Slovak (83.2%, a difference of 0.010%), Immigrants from Romania (83.3%, a difference of 0.020%), and Ukrainian (83.2%, a difference of 0.020%).
| Demographics | Rating | Rank | In Labor Force | Age 45-54 |
| Immigrants | Middle Africa | 94.3 /100 | #99 | Exceptional 83.3% |
| Mongolians | 94.2 /100 | #100 | Exceptional 83.3% |
| Immigrants | Belarus | 94.1 /100 | #101 | Exceptional 83.3% |
| Immigrants | Singapore | 93.9 /100 | #102 | Exceptional 83.3% |
| Albanians | 93.9 /100 | #103 | Exceptional 83.3% |
| Immigrants | Romania | 93.8 /100 | #104 | Exceptional 83.3% |
| Immigrants | South America | 93.5 /100 | #105 | Exceptional 83.2% |
| Sri Lankans | 93.2 /100 | #106 | Exceptional 83.2% |
| Iranians | 92.9 /100 | #107 | Exceptional 83.2% |
| Slovaks | 92.8 /100 | #108 | Exceptional 83.2% |
| Ukrainians | 92.7 /100 | #109 | Exceptional 83.2% |
| Immigrants | Africa | 92.6 /100 | #110 | Exceptional 83.2% |
| Immigrants | Italy | 92.5 /100 | #111 | Exceptional 83.2% |
| Immigrants | Afghanistan | 92.4 /100 | #112 | Exceptional 83.2% |
| Immigrants | Albania | 91.8 /100 | #113 | Exceptional 83.2% |