West Indian vs African In Labor Force | Age 20-24
COMPARE
West Indian
African
In Labor Force | Age 20-24
In Labor Force | Age 20-24 Comparison
West Indians
Africans
71.3%
IN LABOR FORCE | AGE 20-24
0.0/ 100
METRIC RATING
323rd/ 347
METRIC RANK
75.0%
IN LABOR FORCE | AGE 20-24
42.5/ 100
METRIC RATING
181st/ 347
METRIC RANK
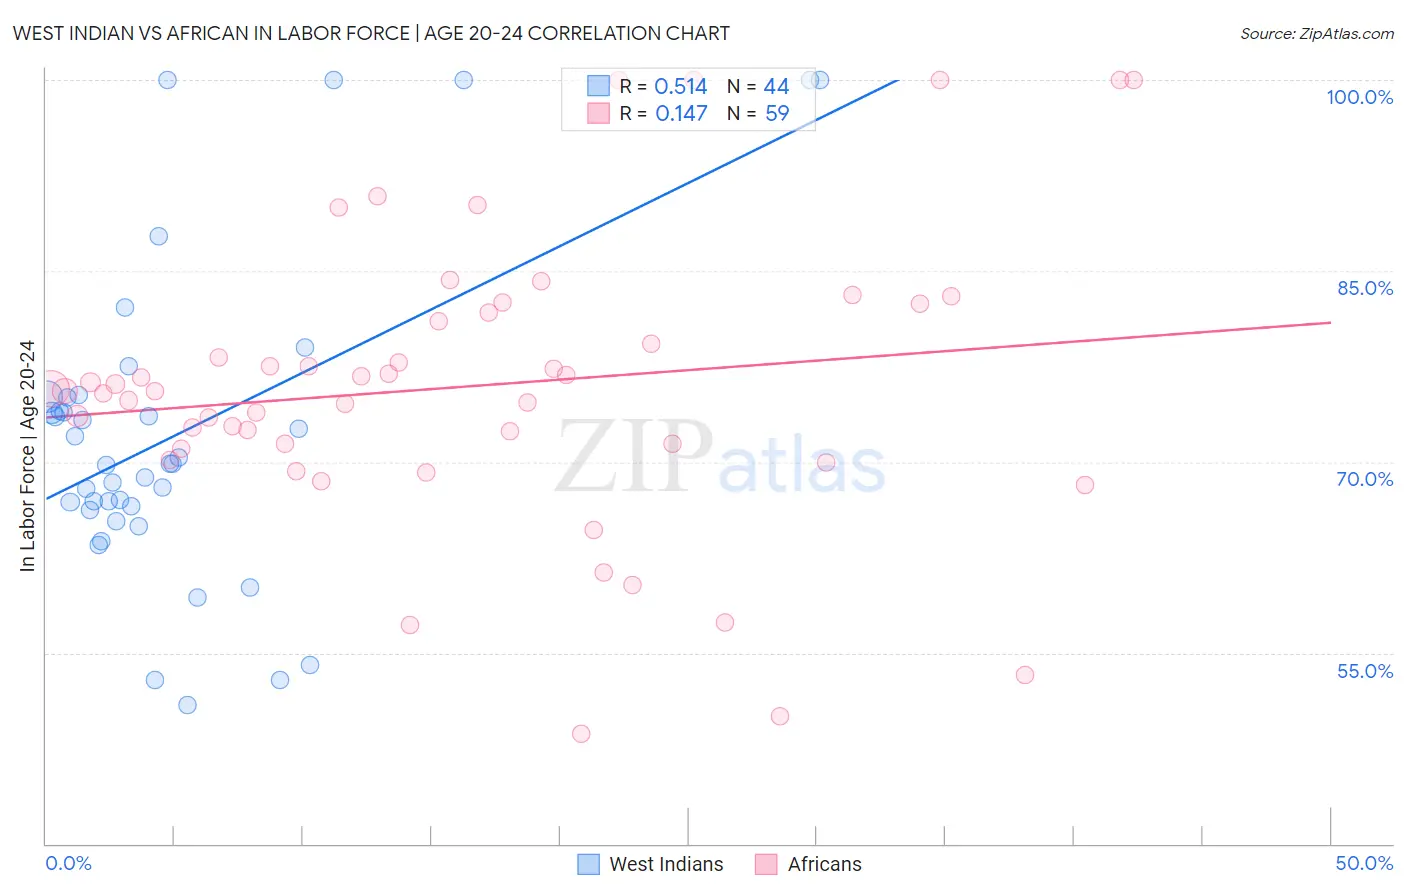
West Indian vs African In Labor Force | Age 20-24 Correlation Chart
The statistical analysis conducted on geographies consisting of 254,022,866 people shows a substantial positive correlation between the proportion of West Indians and labor force participation rate among population between the ages 20 and 24 in the United States with a correlation coefficient (R) of 0.514 and weighted average of 71.3%. Similarly, the statistical analysis conducted on geographies consisting of 469,871,149 people shows a poor positive correlation between the proportion of Africans and labor force participation rate among population between the ages 20 and 24 in the United States with a correlation coefficient (R) of 0.147 and weighted average of 75.0%, a difference of 5.2%.
In Labor Force | Age 20-24 Correlation Summary
| Measurement | West Indian | African |
| Minimum | 50.9% | 48.6% |
| Maximum | 100.0% | 100.0% |
| Range | 49.1% | 51.4% |
| Mean | 72.3% | 75.9% |
| Median | 69.9% | 75.6% |
| Interquartile 25% (IQ1) | 66.3% | 71.0% |
| Interquartile 75% (IQ3) | 75.1% | 81.7% |
| Interquartile Range (IQR) | 8.7% | 10.7% |
| Standard Deviation (Sample) | 12.5% | 11.4% |
| Standard Deviation (Population) | 12.3% | 11.3% |
Similar Demographics by In Labor Force | Age 20-24
Demographics Similar to West Indians by In Labor Force | Age 20-24
In terms of in labor force | age 20-24, the demographic groups most similar to West Indians are Immigrants from Dominican Republic (71.2%, a difference of 0.090%), Filipino (71.4%, a difference of 0.18%), Barbadian (71.1%, a difference of 0.20%), Dominican (71.1%, a difference of 0.28%), and Immigrants from Trinidad and Tobago (71.1%, a difference of 0.28%).
| Demographics | Rating | Rank | In Labor Force | Age 20-24 |
| Immigrants | Eastern Asia | 0.0 /100 | #316 | Tragic 71.8% |
| Immigrants | Armenia | 0.0 /100 | #317 | Tragic 71.7% |
| Immigrants | Hong Kong | 0.0 /100 | #318 | Tragic 71.6% |
| Immigrants | Israel | 0.0 /100 | #319 | Tragic 71.6% |
| Trinidadians and Tobagonians | 0.0 /100 | #320 | Tragic 71.5% |
| Immigrants | Taiwan | 0.0 /100 | #321 | Tragic 71.5% |
| Filipinos | 0.0 /100 | #322 | Tragic 71.4% |
| West Indians | 0.0 /100 | #323 | Tragic 71.3% |
| Immigrants | Dominican Republic | 0.0 /100 | #324 | Tragic 71.2% |
| Barbadians | 0.0 /100 | #325 | Tragic 71.1% |
| Dominicans | 0.0 /100 | #326 | Tragic 71.1% |
| Immigrants | Trinidad and Tobago | 0.0 /100 | #327 | Tragic 71.1% |
| Immigrants | China | 0.0 /100 | #328 | Tragic 71.1% |
| Yup'ik | 0.0 /100 | #329 | Tragic 70.9% |
| Vietnamese | 0.0 /100 | #330 | Tragic 70.6% |
Demographics Similar to Africans by In Labor Force | Age 20-24
In terms of in labor force | age 20-24, the demographic groups most similar to Africans are Immigrants from Latvia (75.0%, a difference of 0.020%), Immigrants from Czechoslovakia (75.0%, a difference of 0.020%), Immigrants from Central America (75.0%, a difference of 0.040%), Immigrants from Mexico (75.0%, a difference of 0.080%), and Immigrants from South Africa (74.9%, a difference of 0.080%).
| Demographics | Rating | Rank | In Labor Force | Age 20-24 |
| South Africans | 50.0 /100 | #174 | Average 75.0% |
| Syrians | 49.5 /100 | #175 | Average 75.0% |
| Central Americans | 48.7 /100 | #176 | Average 75.0% |
| Immigrants | Mexico | 47.8 /100 | #177 | Average 75.0% |
| Immigrants | Central America | 45.0 /100 | #178 | Average 75.0% |
| Immigrants | Latvia | 44.1 /100 | #179 | Average 75.0% |
| Immigrants | Czechoslovakia | 44.0 /100 | #180 | Average 75.0% |
| Africans | 42.5 /100 | #181 | Average 75.0% |
| Immigrants | South Africa | 36.9 /100 | #182 | Fair 74.9% |
| Immigrants | Costa Rica | 36.7 /100 | #183 | Fair 74.9% |
| Immigrants | Hungary | 35.0 /100 | #184 | Fair 74.9% |
| Sri Lankans | 34.9 /100 | #185 | Fair 74.9% |
| Immigrants | Eastern Europe | 33.8 /100 | #186 | Fair 74.9% |
| Immigrants | Honduras | 33.5 /100 | #187 | Fair 74.9% |
| Hondurans | 32.7 /100 | #188 | Fair 74.8% |