Immigrants from Czechoslovakia vs African In Labor Force | Age 20-24
COMPARE
Immigrants from Czechoslovakia
African
In Labor Force | Age 20-24
In Labor Force | Age 20-24 Comparison
Immigrants from Czechoslovakia
Africans
75.0%
IN LABOR FORCE | AGE 20-24
44.0/ 100
METRIC RATING
180th/ 347
METRIC RANK
75.0%
IN LABOR FORCE | AGE 20-24
42.5/ 100
METRIC RATING
181st/ 347
METRIC RANK
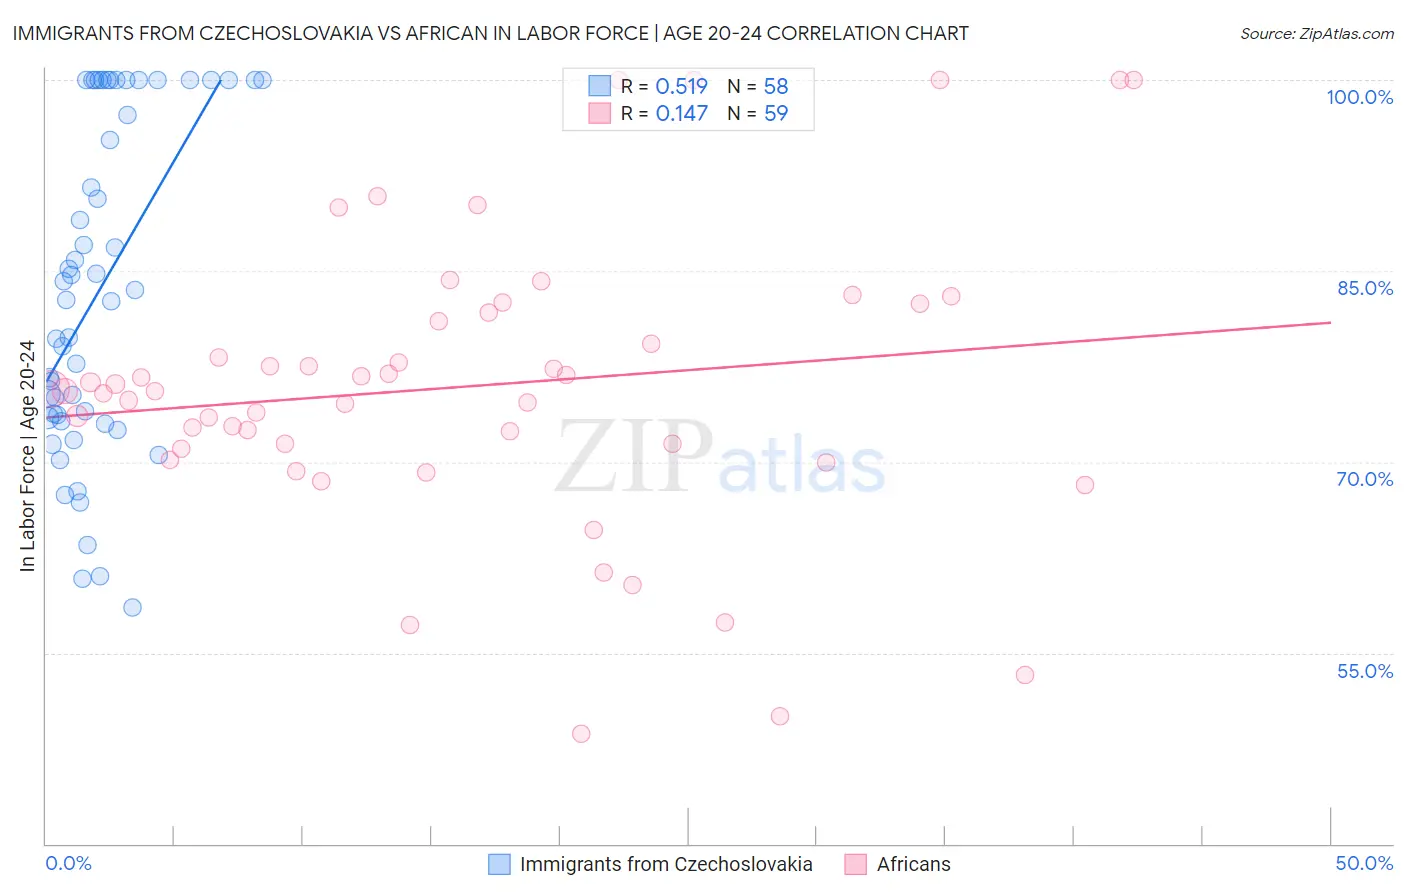
Immigrants from Czechoslovakia vs African In Labor Force | Age 20-24 Correlation Chart
The statistical analysis conducted on geographies consisting of 195,383,549 people shows a substantial positive correlation between the proportion of Immigrants from Czechoslovakia and labor force participation rate among population between the ages 20 and 24 in the United States with a correlation coefficient (R) of 0.519 and weighted average of 75.0%. Similarly, the statistical analysis conducted on geographies consisting of 469,871,149 people shows a poor positive correlation between the proportion of Africans and labor force participation rate among population between the ages 20 and 24 in the United States with a correlation coefficient (R) of 0.147 and weighted average of 75.0%, a difference of 0.020%.
In Labor Force | Age 20-24 Correlation Summary
| Measurement | Immigrants from Czechoslovakia | African |
| Minimum | 58.6% | 48.6% |
| Maximum | 100.0% | 100.0% |
| Range | 41.4% | 51.4% |
| Mean | 83.6% | 75.9% |
| Median | 83.1% | 75.6% |
| Interquartile 25% (IQ1) | 73.5% | 71.0% |
| Interquartile 75% (IQ3) | 100.0% | 81.7% |
| Interquartile Range (IQR) | 26.5% | 10.7% |
| Standard Deviation (Sample) | 12.9% | 11.4% |
| Standard Deviation (Population) | 12.8% | 11.3% |
Demographics Similar to Immigrants from Czechoslovakia and Africans by In Labor Force | Age 20-24
In terms of in labor force | age 20-24, the demographic groups most similar to Immigrants from Czechoslovakia are Immigrants from Latvia (75.0%, a difference of 0.0%), Immigrants from Central America (75.0%, a difference of 0.010%), Immigrants from Mexico (75.0%, a difference of 0.060%), Central American (75.0%, a difference of 0.070%), and Syrian (75.0%, a difference of 0.080%). Similarly, the demographic groups most similar to Africans are Immigrants from Latvia (75.0%, a difference of 0.020%), Immigrants from Central America (75.0%, a difference of 0.040%), Immigrants from Mexico (75.0%, a difference of 0.080%), Immigrants from South Africa (74.9%, a difference of 0.080%), and Central American (75.0%, a difference of 0.090%).
| Demographics | Rating | Rank | In Labor Force | Age 20-24 |
| Mexicans | 52.1 /100 | #170 | Average 75.1% |
| Cajuns | 51.1 /100 | #171 | Average 75.1% |
| Yakama | 50.8 /100 | #172 | Average 75.1% |
| Immigrants | Croatia | 50.2 /100 | #173 | Average 75.1% |
| South Africans | 50.0 /100 | #174 | Average 75.0% |
| Syrians | 49.5 /100 | #175 | Average 75.0% |
| Central Americans | 48.7 /100 | #176 | Average 75.0% |
| Immigrants | Mexico | 47.8 /100 | #177 | Average 75.0% |
| Immigrants | Central America | 45.0 /100 | #178 | Average 75.0% |
| Immigrants | Latvia | 44.1 /100 | #179 | Average 75.0% |
| Immigrants | Czechoslovakia | 44.0 /100 | #180 | Average 75.0% |
| Africans | 42.5 /100 | #181 | Average 75.0% |
| Immigrants | South Africa | 36.9 /100 | #182 | Fair 74.9% |
| Immigrants | Costa Rica | 36.7 /100 | #183 | Fair 74.9% |
| Immigrants | Hungary | 35.0 /100 | #184 | Fair 74.9% |
| Sri Lankans | 34.9 /100 | #185 | Fair 74.9% |
| Immigrants | Eastern Europe | 33.8 /100 | #186 | Fair 74.9% |
| Immigrants | Honduras | 33.5 /100 | #187 | Fair 74.9% |
| Hondurans | 32.7 /100 | #188 | Fair 74.8% |
| Immigrants | Northern Europe | 32.6 /100 | #189 | Fair 74.8% |
| Russians | 32.2 /100 | #190 | Fair 74.8% |