West Indian vs Estonian In Labor Force | Age 20-24
COMPARE
West Indian
Estonian
In Labor Force | Age 20-24
In Labor Force | Age 20-24 Comparison
West Indians
Estonians
71.3%
IN LABOR FORCE | AGE 20-24
0.0/ 100
METRIC RATING
323rd/ 347
METRIC RANK
75.6%
IN LABOR FORCE | AGE 20-24
87.1/ 100
METRIC RATING
134th/ 347
METRIC RANK
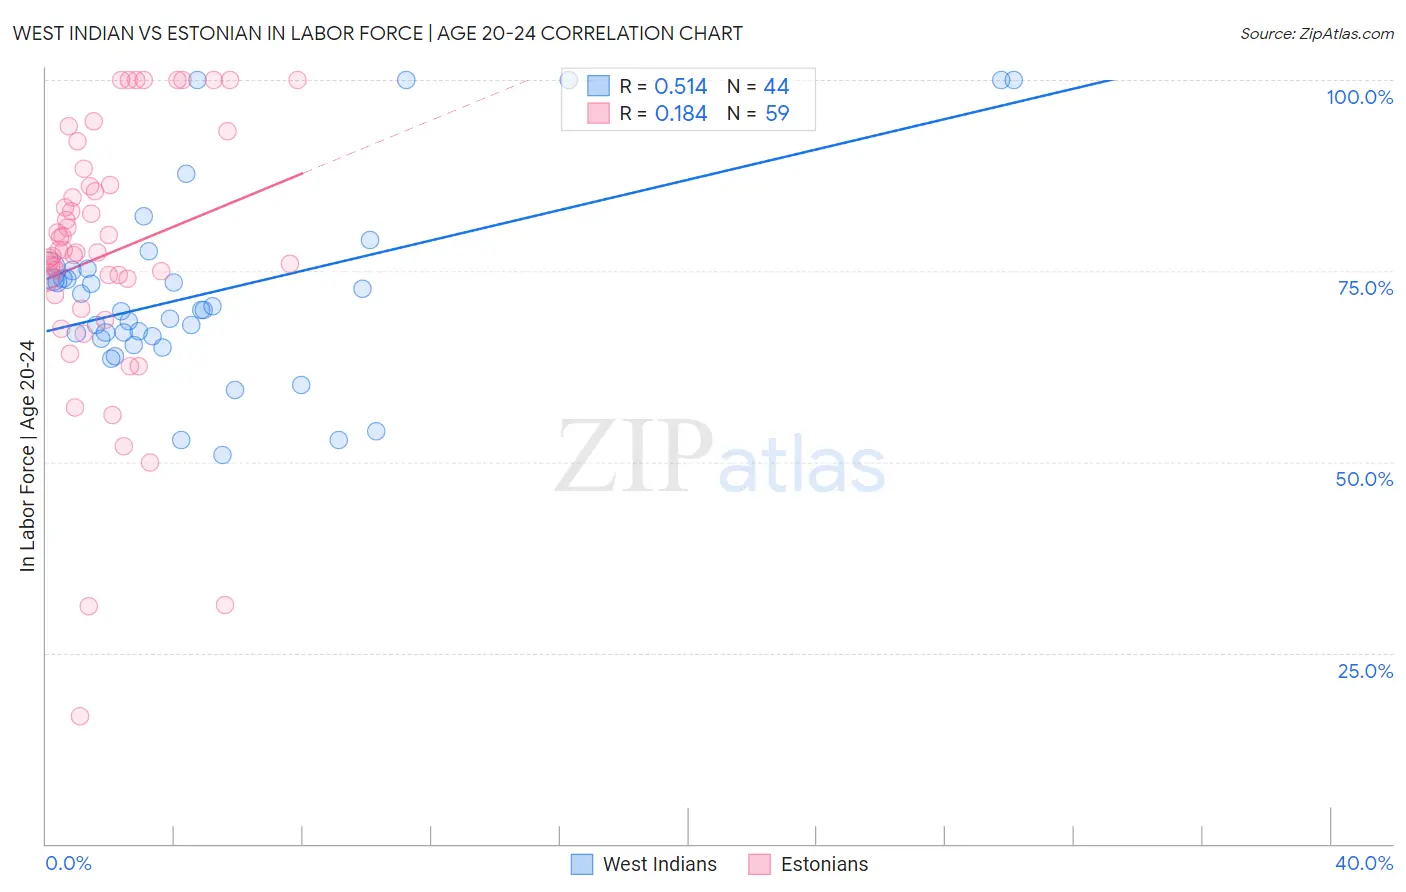
West Indian vs Estonian In Labor Force | Age 20-24 Correlation Chart
The statistical analysis conducted on geographies consisting of 254,022,866 people shows a substantial positive correlation between the proportion of West Indians and labor force participation rate among population between the ages 20 and 24 in the United States with a correlation coefficient (R) of 0.514 and weighted average of 71.3%. Similarly, the statistical analysis conducted on geographies consisting of 123,512,369 people shows a poor positive correlation between the proportion of Estonians and labor force participation rate among population between the ages 20 and 24 in the United States with a correlation coefficient (R) of 0.184 and weighted average of 75.6%, a difference of 6.0%.
In Labor Force | Age 20-24 Correlation Summary
| Measurement | West Indian | Estonian |
| Minimum | 50.9% | 16.7% |
| Maximum | 100.0% | 100.0% |
| Range | 49.1% | 83.3% |
| Mean | 72.3% | 77.2% |
| Median | 69.9% | 77.5% |
| Interquartile 25% (IQ1) | 66.3% | 71.9% |
| Interquartile 75% (IQ3) | 75.1% | 86.3% |
| Interquartile Range (IQR) | 8.7% | 14.4% |
| Standard Deviation (Sample) | 12.5% | 17.3% |
| Standard Deviation (Population) | 12.3% | 17.2% |
Similar Demographics by In Labor Force | Age 20-24
Demographics Similar to West Indians by In Labor Force | Age 20-24
In terms of in labor force | age 20-24, the demographic groups most similar to West Indians are Immigrants from Dominican Republic (71.2%, a difference of 0.090%), Filipino (71.4%, a difference of 0.18%), Barbadian (71.1%, a difference of 0.20%), Dominican (71.1%, a difference of 0.28%), and Immigrants from Trinidad and Tobago (71.1%, a difference of 0.28%).
| Demographics | Rating | Rank | In Labor Force | Age 20-24 |
| Immigrants | Eastern Asia | 0.0 /100 | #316 | Tragic 71.8% |
| Immigrants | Armenia | 0.0 /100 | #317 | Tragic 71.7% |
| Immigrants | Hong Kong | 0.0 /100 | #318 | Tragic 71.6% |
| Immigrants | Israel | 0.0 /100 | #319 | Tragic 71.6% |
| Trinidadians and Tobagonians | 0.0 /100 | #320 | Tragic 71.5% |
| Immigrants | Taiwan | 0.0 /100 | #321 | Tragic 71.5% |
| Filipinos | 0.0 /100 | #322 | Tragic 71.4% |
| West Indians | 0.0 /100 | #323 | Tragic 71.3% |
| Immigrants | Dominican Republic | 0.0 /100 | #324 | Tragic 71.2% |
| Barbadians | 0.0 /100 | #325 | Tragic 71.1% |
| Dominicans | 0.0 /100 | #326 | Tragic 71.1% |
| Immigrants | Trinidad and Tobago | 0.0 /100 | #327 | Tragic 71.1% |
| Immigrants | China | 0.0 /100 | #328 | Tragic 71.1% |
| Yup'ik | 0.0 /100 | #329 | Tragic 70.9% |
| Vietnamese | 0.0 /100 | #330 | Tragic 70.6% |
Demographics Similar to Estonians by In Labor Force | Age 20-24
In terms of in labor force | age 20-24, the demographic groups most similar to Estonians are Zimbabwean (75.6%, a difference of 0.040%), Immigrants from Jordan (75.6%, a difference of 0.050%), Palestinian (75.6%, a difference of 0.050%), Yaqui (75.5%, a difference of 0.050%), and Immigrants from Austria (75.6%, a difference of 0.060%).
| Demographics | Rating | Rank | In Labor Force | Age 20-24 |
| Sub-Saharan Africans | 90.9 /100 | #127 | Exceptional 75.7% |
| Immigrants | Afghanistan | 89.4 /100 | #128 | Excellent 75.6% |
| Iroquois | 89.1 /100 | #129 | Excellent 75.6% |
| Immigrants | Austria | 88.8 /100 | #130 | Excellent 75.6% |
| Immigrants | Jordan | 88.5 /100 | #131 | Excellent 75.6% |
| Palestinians | 88.4 /100 | #132 | Excellent 75.6% |
| Zimbabweans | 88.2 /100 | #133 | Excellent 75.6% |
| Estonians | 87.1 /100 | #134 | Excellent 75.6% |
| Yaqui | 85.5 /100 | #135 | Excellent 75.5% |
| Immigrants | Brazil | 84.8 /100 | #136 | Excellent 75.5% |
| Jordanians | 84.8 /100 | #137 | Excellent 75.5% |
| Australians | 84.8 /100 | #138 | Excellent 75.5% |
| Immigrants | England | 84.6 /100 | #139 | Excellent 75.5% |
| Delaware | 84.5 /100 | #140 | Excellent 75.5% |
| Romanians | 84.1 /100 | #141 | Excellent 75.5% |