Welsh vs Immigrants from Africa In Labor Force | Age 16-19
COMPARE
Welsh
Immigrants from Africa
In Labor Force | Age 16-19
In Labor Force | Age 16-19 Comparison
Welsh
Immigrants from Africa
42.3%
IN LABOR FORCE | AGE 16-19
100.0/ 100
METRIC RATING
27th/ 347
METRIC RANK
38.0%
IN LABOR FORCE | AGE 16-19
96.1/ 100
METRIC RATING
125th/ 347
METRIC RANK
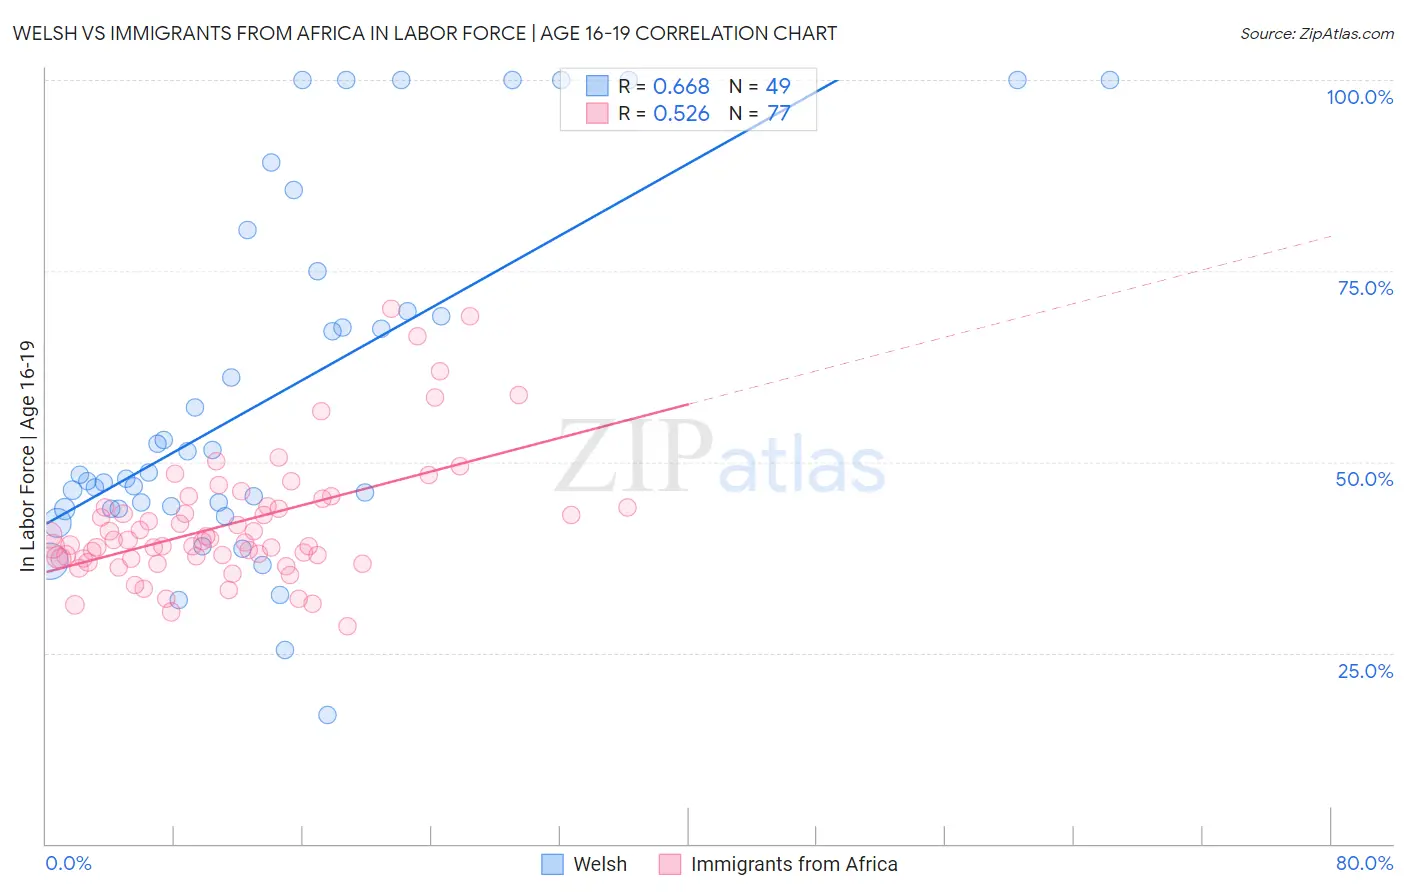
Welsh vs Immigrants from Africa In Labor Force | Age 16-19 Correlation Chart
The statistical analysis conducted on geographies consisting of 526,098,531 people shows a significant positive correlation between the proportion of Welsh and labor force participation rate among population between the ages 16 and 19 in the United States with a correlation coefficient (R) of 0.668 and weighted average of 42.3%. Similarly, the statistical analysis conducted on geographies consisting of 468,482,228 people shows a substantial positive correlation between the proportion of Immigrants from Africa and labor force participation rate among population between the ages 16 and 19 in the United States with a correlation coefficient (R) of 0.526 and weighted average of 38.0%, a difference of 11.1%.
In Labor Force | Age 16-19 Correlation Summary
| Measurement | Welsh | Immigrants from Africa |
| Minimum | 16.8% | 28.5% |
| Maximum | 100.0% | 70.1% |
| Range | 83.2% | 41.6% |
| Mean | 58.7% | 41.9% |
| Median | 48.3% | 39.6% |
| Interquartile 25% (IQ1) | 43.9% | 37.3% |
| Interquartile 75% (IQ3) | 72.3% | 44.1% |
| Interquartile Range (IQR) | 28.4% | 6.7% |
| Standard Deviation (Sample) | 23.2% | 8.3% |
| Standard Deviation (Population) | 23.0% | 8.3% |
Similar Demographics by In Labor Force | Age 16-19
Demographics Similar to Welsh by In Labor Force | Age 16-19
In terms of in labor force | age 16-19, the demographic groups most similar to Welsh are English (42.4%, a difference of 0.28%), Polish (42.1%, a difference of 0.29%), French (42.1%, a difference of 0.35%), German Russian (42.4%, a difference of 0.40%), and Bangladeshi (42.5%, a difference of 0.48%).
| Demographics | Rating | Rank | In Labor Force | Age 16-19 |
| Swiss | 100.0 /100 | #20 | Exceptional 43.3% |
| Ottawa | 100.0 /100 | #21 | Exceptional 43.0% |
| Sudanese | 100.0 /100 | #22 | Exceptional 42.9% |
| Slovaks | 100.0 /100 | #23 | Exceptional 42.6% |
| Bangladeshis | 100.0 /100 | #24 | Exceptional 42.5% |
| German Russians | 100.0 /100 | #25 | Exceptional 42.4% |
| English | 100.0 /100 | #26 | Exceptional 42.4% |
| Welsh | 100.0 /100 | #27 | Exceptional 42.3% |
| Poles | 100.0 /100 | #28 | Exceptional 42.1% |
| French | 100.0 /100 | #29 | Exceptional 42.1% |
| Scottish | 100.0 /100 | #30 | Exceptional 42.0% |
| Irish | 100.0 /100 | #31 | Exceptional 42.0% |
| Czechoslovakians | 100.0 /100 | #32 | Exceptional 41.9% |
| Liberians | 100.0 /100 | #33 | Exceptional 41.8% |
| Immigrants | Bosnia and Herzegovina | 100.0 /100 | #34 | Exceptional 41.8% |
Demographics Similar to Immigrants from Africa by In Labor Force | Age 16-19
In terms of in labor force | age 16-19, the demographic groups most similar to Immigrants from Africa are Immigrants from England (38.1%, a difference of 0.10%), African (38.0%, a difference of 0.16%), Choctaw (38.0%, a difference of 0.16%), New Zealander (38.0%, a difference of 0.17%), and Seminole (38.1%, a difference of 0.19%).
| Demographics | Rating | Rank | In Labor Force | Age 16-19 |
| Immigrants | Nepal | 97.8 /100 | #118 | Exceptional 38.3% |
| Assyrians/Chaldeans/Syriacs | 97.8 /100 | #119 | Exceptional 38.3% |
| Ukrainians | 97.6 /100 | #120 | Exceptional 38.3% |
| Ethiopians | 97.4 /100 | #121 | Exceptional 38.2% |
| Guamanians/Chamorros | 97.4 /100 | #122 | Exceptional 38.2% |
| Seminole | 96.7 /100 | #123 | Exceptional 38.1% |
| Immigrants | England | 96.4 /100 | #124 | Exceptional 38.1% |
| Immigrants | Africa | 96.1 /100 | #125 | Exceptional 38.0% |
| Africans | 95.6 /100 | #126 | Exceptional 38.0% |
| Choctaw | 95.6 /100 | #127 | Exceptional 38.0% |
| New Zealanders | 95.6 /100 | #128 | Exceptional 38.0% |
| Spaniards | 95.5 /100 | #129 | Exceptional 38.0% |
| Immigrants | Zimbabwe | 95.4 /100 | #130 | Exceptional 38.0% |
| Immigrants | Austria | 95.0 /100 | #131 | Exceptional 37.9% |
| Immigrants | Oceania | 94.7 /100 | #132 | Exceptional 37.9% |