Vietnamese vs Welsh In Labor Force | Age 16-19
COMPARE
Vietnamese
Welsh
In Labor Force | Age 16-19
In Labor Force | Age 16-19 Comparison
Vietnamese
Welsh
29.6%
IN LABOR FORCE | AGE 16-19
0.0/ 100
METRIC RATING
338th/ 347
METRIC RANK
42.3%
IN LABOR FORCE | AGE 16-19
100.0/ 100
METRIC RATING
27th/ 347
METRIC RANK
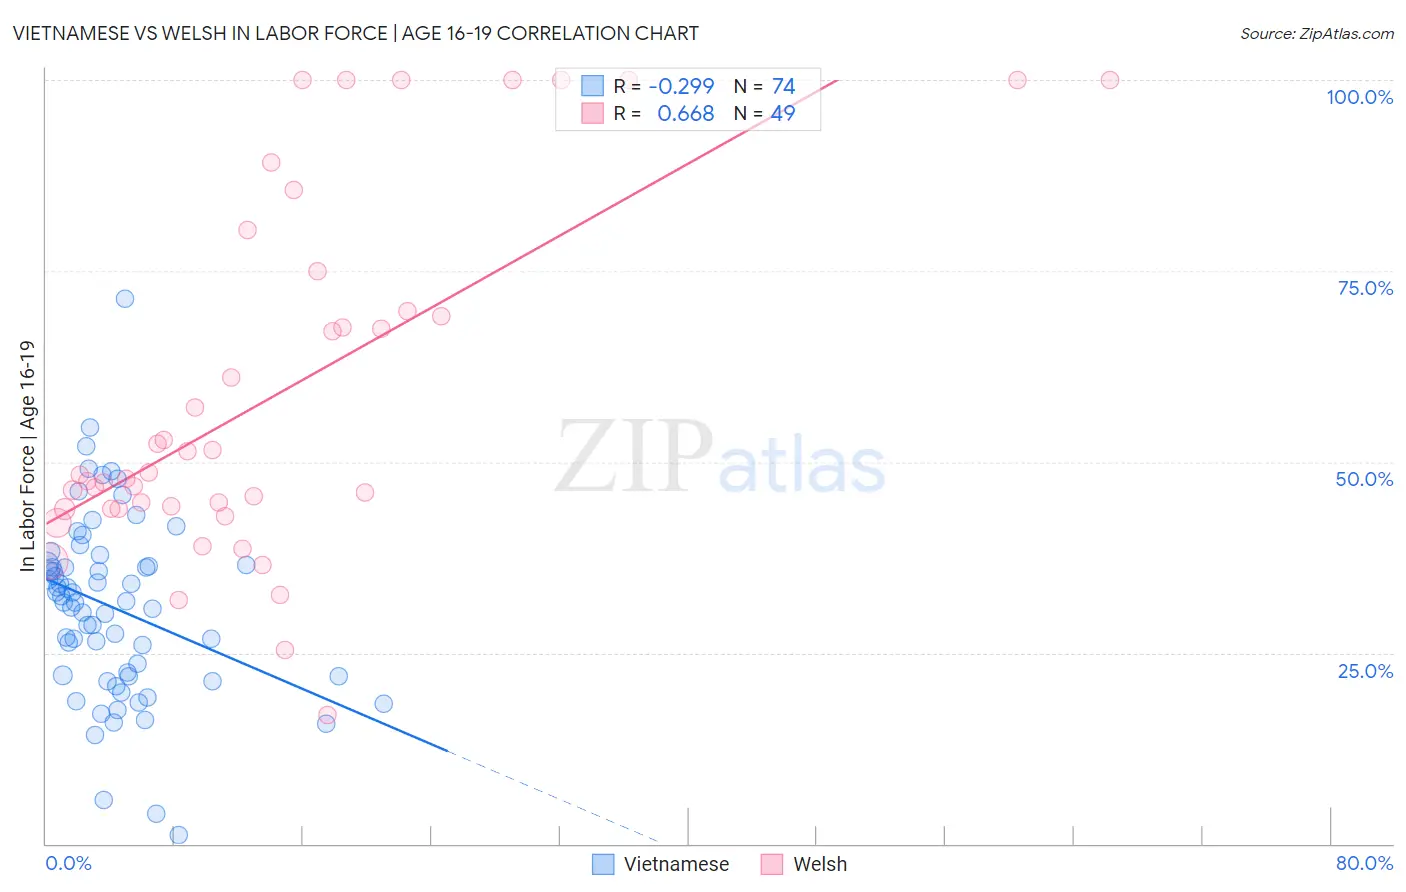
Vietnamese vs Welsh In Labor Force | Age 16-19 Correlation Chart
The statistical analysis conducted on geographies consisting of 170,670,712 people shows a weak negative correlation between the proportion of Vietnamese and labor force participation rate among population between the ages 16 and 19 in the United States with a correlation coefficient (R) of -0.299 and weighted average of 29.6%. Similarly, the statistical analysis conducted on geographies consisting of 526,098,531 people shows a significant positive correlation between the proportion of Welsh and labor force participation rate among population between the ages 16 and 19 in the United States with a correlation coefficient (R) of 0.668 and weighted average of 42.3%, a difference of 43.0%.
In Labor Force | Age 16-19 Correlation Summary
| Measurement | Vietnamese | Welsh |
| Minimum | 1.1% | 16.8% |
| Maximum | 71.4% | 100.0% |
| Range | 70.3% | 83.2% |
| Mean | 30.9% | 58.7% |
| Median | 31.6% | 48.3% |
| Interquartile 25% (IQ1) | 22.0% | 43.9% |
| Interquartile 75% (IQ3) | 36.5% | 72.3% |
| Interquartile Range (IQR) | 14.5% | 28.4% |
| Standard Deviation (Sample) | 12.0% | 23.2% |
| Standard Deviation (Population) | 11.9% | 23.0% |
Similar Demographics by In Labor Force | Age 16-19
Demographics Similar to Vietnamese by In Labor Force | Age 16-19
In terms of in labor force | age 16-19, the demographic groups most similar to Vietnamese are Immigrants from Uzbekistan (29.2%, a difference of 1.4%), British West Indian (29.1%, a difference of 1.6%), Immigrants from Bangladesh (30.0%, a difference of 1.7%), Immigrants from Armenia (29.0%, a difference of 1.8%), and Immigrants from Barbados (29.0%, a difference of 2.0%).
| Demographics | Rating | Rank | In Labor Force | Age 16-19 |
| Trinidadians and Tobagonians | 0.0 /100 | #331 | Tragic 30.9% |
| Immigrants | Israel | 0.0 /100 | #332 | Tragic 30.5% |
| Immigrants | Hong Kong | 0.0 /100 | #333 | Tragic 30.5% |
| Puerto Ricans | 0.0 /100 | #334 | Tragic 30.3% |
| Immigrants | Cuba | 0.0 /100 | #335 | Tragic 30.2% |
| Immigrants | Trinidad and Tobago | 0.0 /100 | #336 | Tragic 30.2% |
| Immigrants | Bangladesh | 0.0 /100 | #337 | Tragic 30.0% |
| Vietnamese | 0.0 /100 | #338 | Tragic 29.6% |
| Immigrants | Uzbekistan | 0.0 /100 | #339 | Tragic 29.2% |
| British West Indians | 0.0 /100 | #340 | Tragic 29.1% |
| Immigrants | Armenia | 0.0 /100 | #341 | Tragic 29.0% |
| Immigrants | Barbados | 0.0 /100 | #342 | Tragic 29.0% |
| Yuman | 0.0 /100 | #343 | Tragic 27.7% |
| Guyanese | 0.0 /100 | #344 | Tragic 27.4% |
| Immigrants | Guyana | 0.0 /100 | #345 | Tragic 27.3% |
Demographics Similar to Welsh by In Labor Force | Age 16-19
In terms of in labor force | age 16-19, the demographic groups most similar to Welsh are English (42.4%, a difference of 0.28%), Polish (42.1%, a difference of 0.29%), French (42.1%, a difference of 0.35%), German Russian (42.4%, a difference of 0.40%), and Bangladeshi (42.5%, a difference of 0.48%).
| Demographics | Rating | Rank | In Labor Force | Age 16-19 |
| Swiss | 100.0 /100 | #20 | Exceptional 43.3% |
| Ottawa | 100.0 /100 | #21 | Exceptional 43.0% |
| Sudanese | 100.0 /100 | #22 | Exceptional 42.9% |
| Slovaks | 100.0 /100 | #23 | Exceptional 42.6% |
| Bangladeshis | 100.0 /100 | #24 | Exceptional 42.5% |
| German Russians | 100.0 /100 | #25 | Exceptional 42.4% |
| English | 100.0 /100 | #26 | Exceptional 42.4% |
| Welsh | 100.0 /100 | #27 | Exceptional 42.3% |
| Poles | 100.0 /100 | #28 | Exceptional 42.1% |
| French | 100.0 /100 | #29 | Exceptional 42.1% |
| Scottish | 100.0 /100 | #30 | Exceptional 42.0% |
| Irish | 100.0 /100 | #31 | Exceptional 42.0% |
| Czechoslovakians | 100.0 /100 | #32 | Exceptional 41.9% |
| Liberians | 100.0 /100 | #33 | Exceptional 41.8% |
| Immigrants | Bosnia and Herzegovina | 100.0 /100 | #34 | Exceptional 41.8% |