Vietnamese vs Immigrants from Argentina In Labor Force | Age 16-19
COMPARE
Vietnamese
Immigrants from Argentina
In Labor Force | Age 16-19
In Labor Force | Age 16-19 Comparison
Vietnamese
Immigrants from Argentina
29.6%
IN LABOR FORCE | AGE 16-19
0.0/ 100
METRIC RATING
338th/ 347
METRIC RANK
32.9%
IN LABOR FORCE | AGE 16-19
0.0/ 100
METRIC RATING
300th/ 347
METRIC RANK
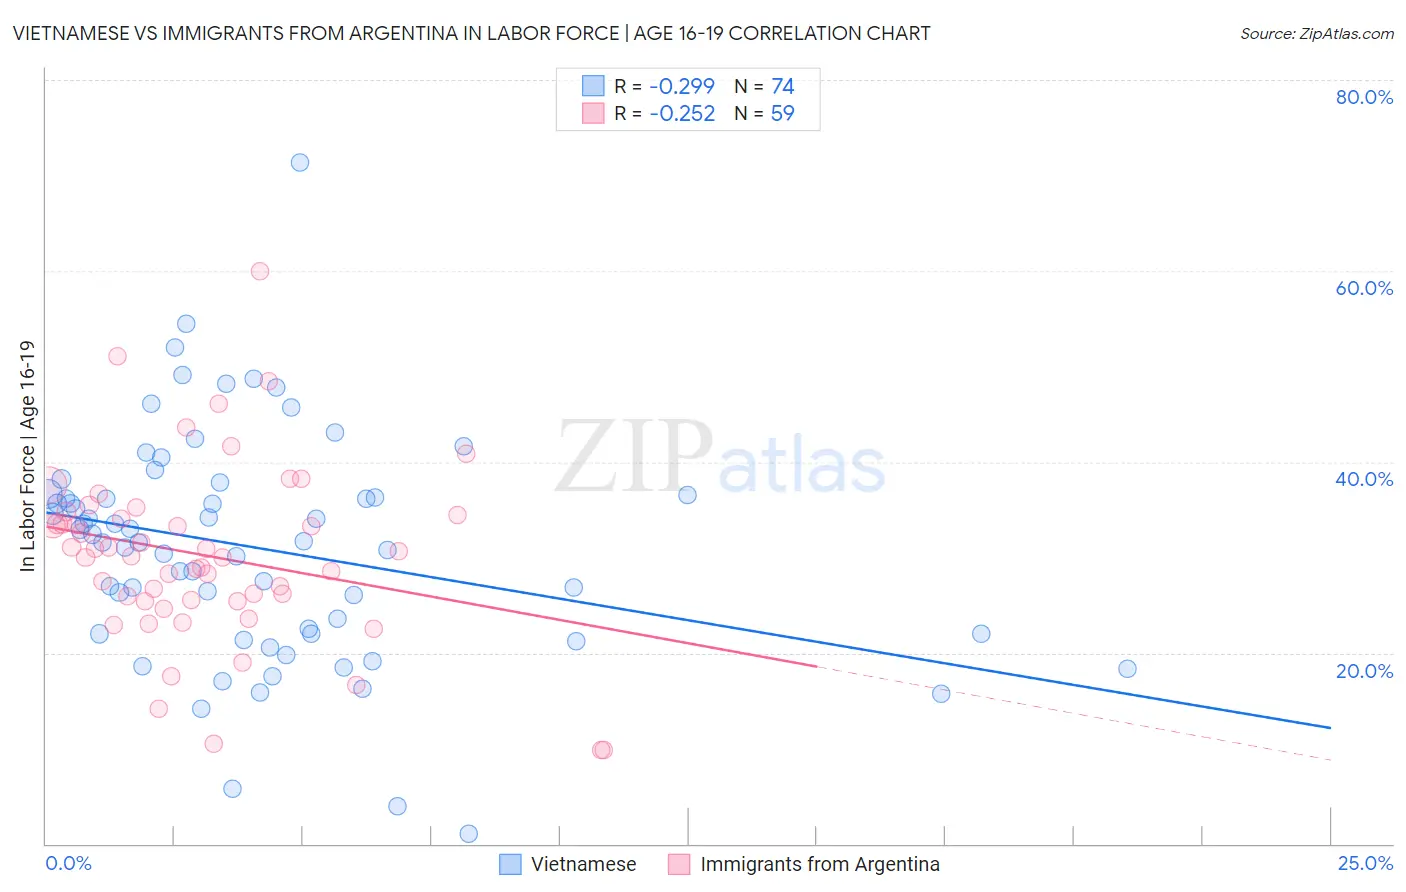
Vietnamese vs Immigrants from Argentina In Labor Force | Age 16-19 Correlation Chart
The statistical analysis conducted on geographies consisting of 170,670,712 people shows a weak negative correlation between the proportion of Vietnamese and labor force participation rate among population between the ages 16 and 19 in the United States with a correlation coefficient (R) of -0.299 and weighted average of 29.6%. Similarly, the statistical analysis conducted on geographies consisting of 264,171,255 people shows a weak negative correlation between the proportion of Immigrants from Argentina and labor force participation rate among population between the ages 16 and 19 in the United States with a correlation coefficient (R) of -0.252 and weighted average of 32.9%, a difference of 11.3%.
In Labor Force | Age 16-19 Correlation Summary
| Measurement | Vietnamese | Immigrants from Argentina |
| Minimum | 1.1% | 9.8% |
| Maximum | 71.4% | 60.0% |
| Range | 70.3% | 50.2% |
| Mean | 30.9% | 30.2% |
| Median | 31.6% | 30.2% |
| Interquartile 25% (IQ1) | 22.0% | 25.5% |
| Interquartile 75% (IQ3) | 36.5% | 34.5% |
| Interquartile Range (IQR) | 14.5% | 9.0% |
| Standard Deviation (Sample) | 12.0% | 9.4% |
| Standard Deviation (Population) | 11.9% | 9.3% |
Similar Demographics by In Labor Force | Age 16-19
Demographics Similar to Vietnamese by In Labor Force | Age 16-19
In terms of in labor force | age 16-19, the demographic groups most similar to Vietnamese are Immigrants from Uzbekistan (29.2%, a difference of 1.4%), British West Indian (29.1%, a difference of 1.6%), Immigrants from Bangladesh (30.0%, a difference of 1.7%), Immigrants from Armenia (29.0%, a difference of 1.8%), and Immigrants from Barbados (29.0%, a difference of 2.0%).
| Demographics | Rating | Rank | In Labor Force | Age 16-19 |
| Trinidadians and Tobagonians | 0.0 /100 | #331 | Tragic 30.9% |
| Immigrants | Israel | 0.0 /100 | #332 | Tragic 30.5% |
| Immigrants | Hong Kong | 0.0 /100 | #333 | Tragic 30.5% |
| Puerto Ricans | 0.0 /100 | #334 | Tragic 30.3% |
| Immigrants | Cuba | 0.0 /100 | #335 | Tragic 30.2% |
| Immigrants | Trinidad and Tobago | 0.0 /100 | #336 | Tragic 30.2% |
| Immigrants | Bangladesh | 0.0 /100 | #337 | Tragic 30.0% |
| Vietnamese | 0.0 /100 | #338 | Tragic 29.6% |
| Immigrants | Uzbekistan | 0.0 /100 | #339 | Tragic 29.2% |
| British West Indians | 0.0 /100 | #340 | Tragic 29.1% |
| Immigrants | Armenia | 0.0 /100 | #341 | Tragic 29.0% |
| Immigrants | Barbados | 0.0 /100 | #342 | Tragic 29.0% |
| Yuman | 0.0 /100 | #343 | Tragic 27.7% |
| Guyanese | 0.0 /100 | #344 | Tragic 27.4% |
| Immigrants | Guyana | 0.0 /100 | #345 | Tragic 27.3% |
Demographics Similar to Immigrants from Argentina by In Labor Force | Age 16-19
In terms of in labor force | age 16-19, the demographic groups most similar to Immigrants from Argentina are Armenian (32.9%, a difference of 0.15%), Okinawan (32.8%, a difference of 0.24%), Belizean (32.8%, a difference of 0.38%), Iranian (33.0%, a difference of 0.40%), and Immigrants from Haiti (33.2%, a difference of 0.91%).
| Demographics | Rating | Rank | In Labor Force | Age 16-19 |
| Immigrants | South America | 0.1 /100 | #293 | Tragic 33.3% |
| Argentineans | 0.1 /100 | #294 | Tragic 33.3% |
| Yup'ik | 0.1 /100 | #295 | Tragic 33.3% |
| Jamaicans | 0.1 /100 | #296 | Tragic 33.2% |
| Immigrants | Haiti | 0.1 /100 | #297 | Tragic 33.2% |
| Iranians | 0.0 /100 | #298 | Tragic 33.0% |
| Armenians | 0.0 /100 | #299 | Tragic 32.9% |
| Immigrants | Argentina | 0.0 /100 | #300 | Tragic 32.9% |
| Okinawans | 0.0 /100 | #301 | Tragic 32.8% |
| Belizeans | 0.0 /100 | #302 | Tragic 32.8% |
| Immigrants | Dominica | 0.0 /100 | #303 | Tragic 32.5% |
| Israelis | 0.0 /100 | #304 | Tragic 32.4% |
| Nicaraguans | 0.0 /100 | #305 | Tragic 32.4% |
| Spanish American Indians | 0.0 /100 | #306 | Tragic 32.4% |
| Immigrants | Jamaica | 0.0 /100 | #307 | Tragic 32.2% |