Vietnamese vs Immigrants from Kuwait In Labor Force | Age 16-19
COMPARE
Vietnamese
Immigrants from Kuwait
In Labor Force | Age 16-19
In Labor Force | Age 16-19 Comparison
Vietnamese
Immigrants from Kuwait
29.6%
IN LABOR FORCE | AGE 16-19
0.0/ 100
METRIC RATING
338th/ 347
METRIC RANK
36.9%
IN LABOR FORCE | AGE 16-19
68.9/ 100
METRIC RATING
164th/ 347
METRIC RANK
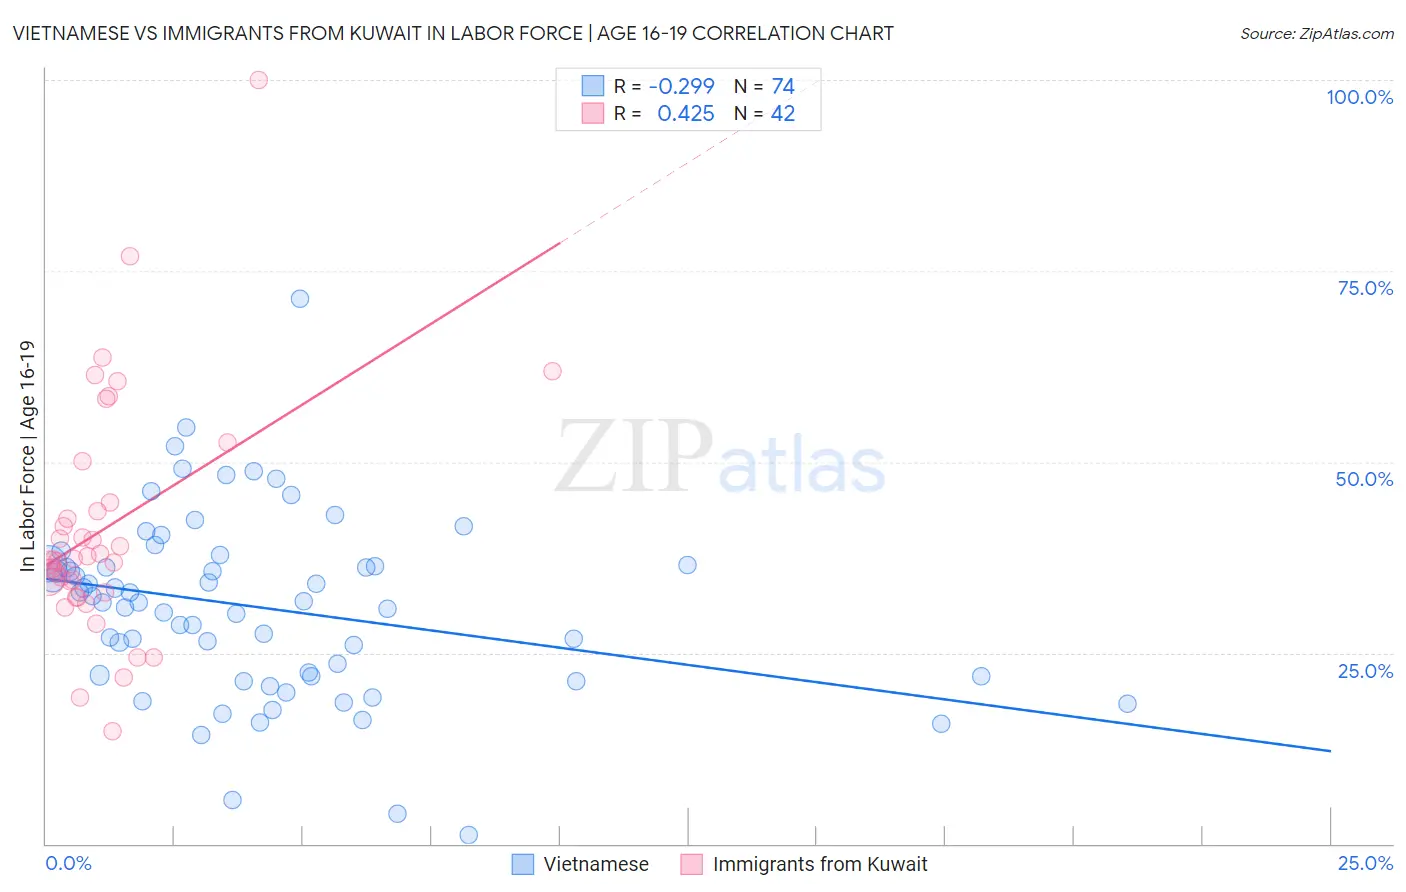
Vietnamese vs Immigrants from Kuwait In Labor Force | Age 16-19 Correlation Chart
The statistical analysis conducted on geographies consisting of 170,670,712 people shows a weak negative correlation between the proportion of Vietnamese and labor force participation rate among population between the ages 16 and 19 in the United States with a correlation coefficient (R) of -0.299 and weighted average of 29.6%. Similarly, the statistical analysis conducted on geographies consisting of 136,896,813 people shows a moderate positive correlation between the proportion of Immigrants from Kuwait and labor force participation rate among population between the ages 16 and 19 in the United States with a correlation coefficient (R) of 0.425 and weighted average of 36.9%, a difference of 25.0%.
In Labor Force | Age 16-19 Correlation Summary
| Measurement | Vietnamese | Immigrants from Kuwait |
| Minimum | 1.1% | 14.8% |
| Maximum | 71.4% | 100.0% |
| Range | 70.3% | 85.2% |
| Mean | 30.9% | 41.4% |
| Median | 31.6% | 37.2% |
| Interquartile 25% (IQ1) | 22.0% | 32.9% |
| Interquartile 75% (IQ3) | 36.5% | 44.7% |
| Interquartile Range (IQR) | 14.5% | 11.8% |
| Standard Deviation (Sample) | 12.0% | 15.9% |
| Standard Deviation (Population) | 11.9% | 15.7% |
Similar Demographics by In Labor Force | Age 16-19
Demographics Similar to Vietnamese by In Labor Force | Age 16-19
In terms of in labor force | age 16-19, the demographic groups most similar to Vietnamese are Immigrants from Uzbekistan (29.2%, a difference of 1.4%), British West Indian (29.1%, a difference of 1.6%), Immigrants from Bangladesh (30.0%, a difference of 1.7%), Immigrants from Armenia (29.0%, a difference of 1.8%), and Immigrants from Barbados (29.0%, a difference of 2.0%).
| Demographics | Rating | Rank | In Labor Force | Age 16-19 |
| Trinidadians and Tobagonians | 0.0 /100 | #331 | Tragic 30.9% |
| Immigrants | Israel | 0.0 /100 | #332 | Tragic 30.5% |
| Immigrants | Hong Kong | 0.0 /100 | #333 | Tragic 30.5% |
| Puerto Ricans | 0.0 /100 | #334 | Tragic 30.3% |
| Immigrants | Cuba | 0.0 /100 | #335 | Tragic 30.2% |
| Immigrants | Trinidad and Tobago | 0.0 /100 | #336 | Tragic 30.2% |
| Immigrants | Bangladesh | 0.0 /100 | #337 | Tragic 30.0% |
| Vietnamese | 0.0 /100 | #338 | Tragic 29.6% |
| Immigrants | Uzbekistan | 0.0 /100 | #339 | Tragic 29.2% |
| British West Indians | 0.0 /100 | #340 | Tragic 29.1% |
| Immigrants | Armenia | 0.0 /100 | #341 | Tragic 29.0% |
| Immigrants | Barbados | 0.0 /100 | #342 | Tragic 29.0% |
| Yuman | 0.0 /100 | #343 | Tragic 27.7% |
| Guyanese | 0.0 /100 | #344 | Tragic 27.4% |
| Immigrants | Guyana | 0.0 /100 | #345 | Tragic 27.3% |
Demographics Similar to Immigrants from Kuwait by In Labor Force | Age 16-19
In terms of in labor force | age 16-19, the demographic groups most similar to Immigrants from Kuwait are Bermudan (36.9%, a difference of 0.020%), Immigrants from Jordan (36.9%, a difference of 0.040%), Yakama (36.9%, a difference of 0.11%), Immigrants from Western Africa (36.9%, a difference of 0.12%), and Cambodian (37.0%, a difference of 0.16%).
| Demographics | Rating | Rank | In Labor Force | Age 16-19 |
| Immigrants | Brazil | 76.5 /100 | #157 | Good 37.1% |
| Ute | 75.7 /100 | #158 | Good 37.1% |
| Yaqui | 74.4 /100 | #159 | Good 37.1% |
| Immigrants | Saudi Arabia | 73.9 /100 | #160 | Good 37.0% |
| Cambodians | 71.5 /100 | #161 | Good 37.0% |
| Immigrants | Jordan | 69.5 /100 | #162 | Good 36.9% |
| Bermudans | 69.3 /100 | #163 | Good 36.9% |
| Immigrants | Kuwait | 68.9 /100 | #164 | Good 36.9% |
| Yakama | 66.9 /100 | #165 | Good 36.9% |
| Immigrants | Western Africa | 66.7 /100 | #166 | Good 36.9% |
| Arabs | 63.6 /100 | #167 | Good 36.8% |
| Palestinians | 63.1 /100 | #168 | Good 36.8% |
| Immigrants | Latvia | 61.6 /100 | #169 | Good 36.8% |
| Immigrants | South Africa | 60.5 /100 | #170 | Good 36.8% |
| Immigrants | Cambodia | 58.4 /100 | #171 | Average 36.7% |