Vietnamese vs Peruvian In Labor Force | Age 30-34
COMPARE
Vietnamese
Peruvian
In Labor Force | Age 30-34
In Labor Force | Age 30-34 Comparison
Vietnamese
Peruvians
83.6%
IN LABOR FORCE | AGE 30-34
0.1/ 100
METRIC RATING
269th/ 347
METRIC RANK
84.8%
IN LABOR FORCE | AGE 30-34
65.9/ 100
METRIC RATING
157th/ 347
METRIC RANK
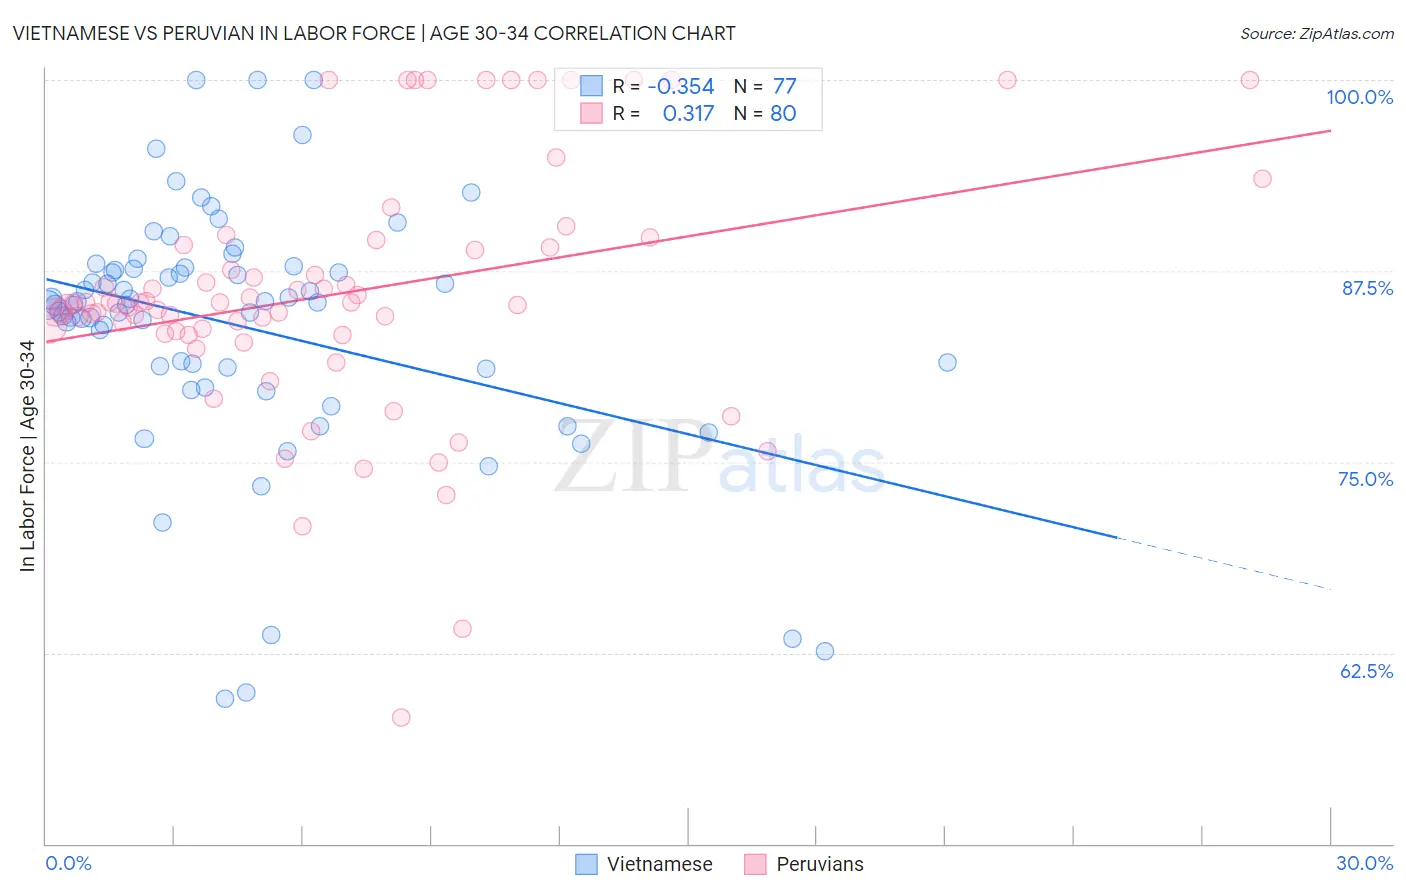
Vietnamese vs Peruvian In Labor Force | Age 30-34 Correlation Chart
The statistical analysis conducted on geographies consisting of 170,686,461 people shows a mild negative correlation between the proportion of Vietnamese and labor force participation rate among population between the ages 30 and 34 in the United States with a correlation coefficient (R) of -0.354 and weighted average of 83.6%. Similarly, the statistical analysis conducted on geographies consisting of 363,011,511 people shows a mild positive correlation between the proportion of Peruvians and labor force participation rate among population between the ages 30 and 34 in the United States with a correlation coefficient (R) of 0.317 and weighted average of 84.8%, a difference of 1.4%.
In Labor Force | Age 30-34 Correlation Summary
| Measurement | Vietnamese | Peruvian |
| Minimum | 59.5% | 58.3% |
| Maximum | 100.0% | 100.0% |
| Range | 40.5% | 41.7% |
| Mean | 83.9% | 86.0% |
| Median | 85.3% | 85.3% |
| Interquartile 25% (IQ1) | 81.1% | 83.5% |
| Interquartile 75% (IQ3) | 87.7% | 89.1% |
| Interquartile Range (IQR) | 6.6% | 5.6% |
| Standard Deviation (Sample) | 8.2% | 8.1% |
| Standard Deviation (Population) | 8.1% | 8.1% |
Similar Demographics by In Labor Force | Age 30-34
Demographics Similar to Vietnamese by In Labor Force | Age 30-34
In terms of in labor force | age 30-34, the demographic groups most similar to Vietnamese are Immigrants from Bangladesh (83.6%, a difference of 0.010%), Spaniard (83.6%, a difference of 0.020%), Spanish American (83.5%, a difference of 0.050%), Spanish (83.5%, a difference of 0.070%), and Nonimmigrants (83.5%, a difference of 0.070%).
| Demographics | Rating | Rank | In Labor Force | Age 30-34 |
| Dominicans | 0.2 /100 | #262 | Tragic 83.8% |
| Immigrants | Guyana | 0.2 /100 | #263 | Tragic 83.8% |
| Guatemalans | 0.2 /100 | #264 | Tragic 83.7% |
| Immigrants | Honduras | 0.1 /100 | #265 | Tragic 83.7% |
| Immigrants | Guatemala | 0.1 /100 | #266 | Tragic 83.7% |
| Spaniards | 0.1 /100 | #267 | Tragic 83.6% |
| Immigrants | Bangladesh | 0.1 /100 | #268 | Tragic 83.6% |
| Vietnamese | 0.1 /100 | #269 | Tragic 83.6% |
| Spanish Americans | 0.0 /100 | #270 | Tragic 83.5% |
| Spanish | 0.0 /100 | #271 | Tragic 83.5% |
| Immigrants | Nonimmigrants | 0.0 /100 | #272 | Tragic 83.5% |
| Guamanians/Chamorros | 0.0 /100 | #273 | Tragic 83.5% |
| Belizeans | 0.0 /100 | #274 | Tragic 83.5% |
| Immigrants | Grenada | 0.0 /100 | #275 | Tragic 83.5% |
| Tongans | 0.0 /100 | #276 | Tragic 83.5% |
Demographics Similar to Peruvians by In Labor Force | Age 30-34
In terms of in labor force | age 30-34, the demographic groups most similar to Peruvians are French Canadian (84.8%, a difference of 0.010%), Immigrants from Armenia (84.8%, a difference of 0.010%), Czechoslovakian (84.8%, a difference of 0.020%), Syrian (84.8%, a difference of 0.030%), and Northern European (84.8%, a difference of 0.030%).
| Demographics | Rating | Rank | In Labor Force | Age 30-34 |
| Germans | 75.1 /100 | #150 | Good 84.8% |
| Immigrants | Senegal | 74.0 /100 | #151 | Good 84.8% |
| Romanians | 73.5 /100 | #152 | Good 84.8% |
| Syrians | 70.1 /100 | #153 | Good 84.8% |
| Northern Europeans | 70.0 /100 | #154 | Good 84.8% |
| Immigrants | Sudan | 69.5 /100 | #155 | Good 84.8% |
| French Canadians | 67.3 /100 | #156 | Good 84.8% |
| Peruvians | 65.9 /100 | #157 | Good 84.8% |
| Immigrants | Armenia | 64.7 /100 | #158 | Good 84.8% |
| Czechoslovakians | 63.0 /100 | #159 | Good 84.8% |
| Pakistanis | 60.8 /100 | #160 | Good 84.7% |
| Immigrants | Cambodia | 60.7 /100 | #161 | Good 84.7% |
| South Americans | 58.7 /100 | #162 | Average 84.7% |
| Immigrants | Uruguay | 57.4 /100 | #163 | Average 84.7% |
| Icelanders | 56.8 /100 | #164 | Average 84.7% |