Slovak vs Immigrants from Cuba In Labor Force | Age 20-24
COMPARE
Slovak
Immigrants from Cuba
In Labor Force | Age 20-24
In Labor Force | Age 20-24 Comparison
Slovaks
Immigrants from Cuba
77.7%
IN LABOR FORCE | AGE 20-24
100.0/ 100
METRIC RATING
29th/ 347
METRIC RANK
72.0%
IN LABOR FORCE | AGE 20-24
0.0/ 100
METRIC RATING
310th/ 347
METRIC RANK
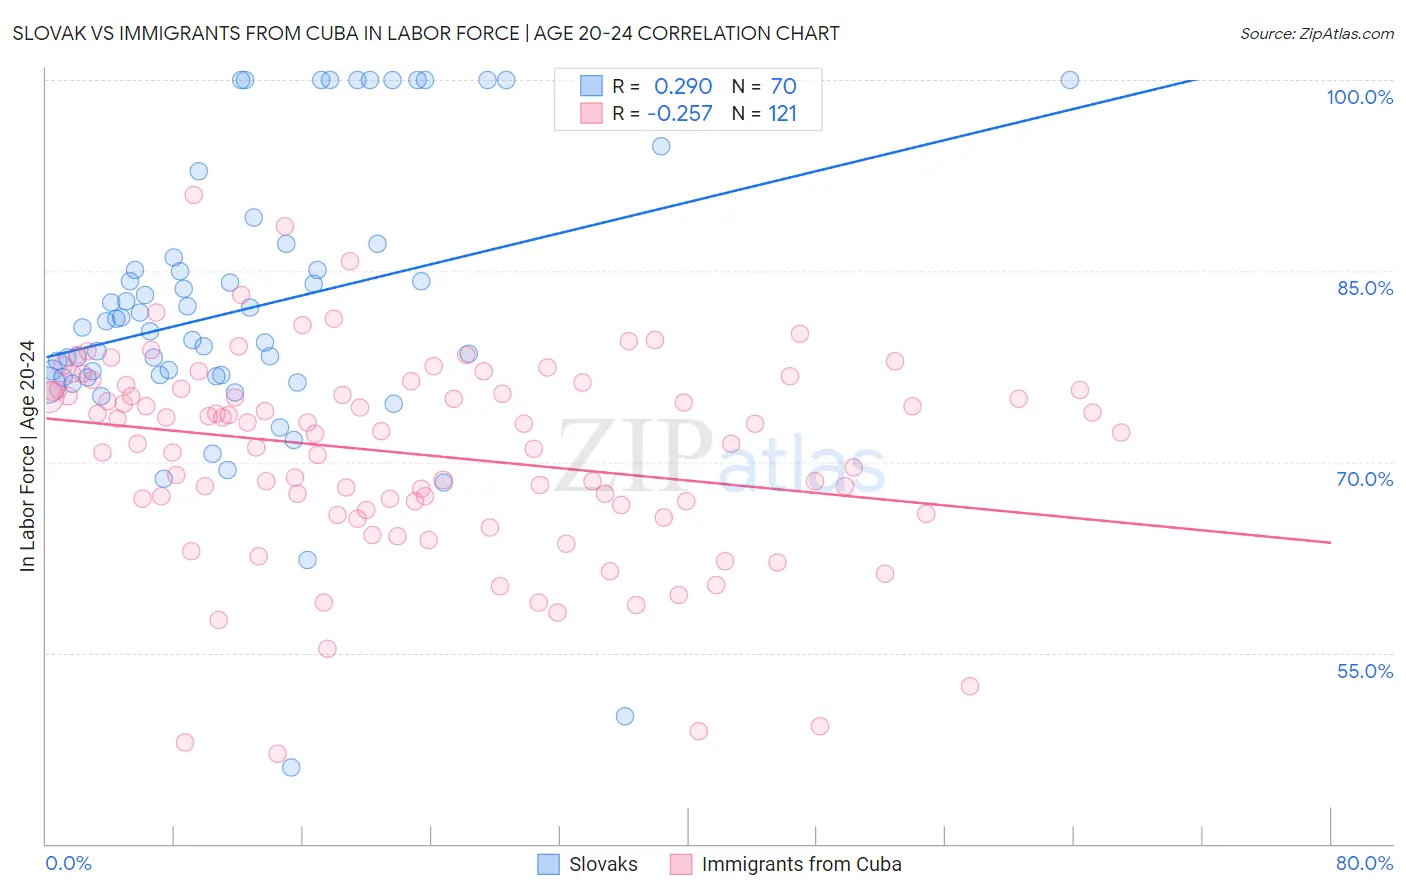
Slovak vs Immigrants from Cuba In Labor Force | Age 20-24 Correlation Chart
The statistical analysis conducted on geographies consisting of 397,601,730 people shows a weak positive correlation between the proportion of Slovaks and labor force participation rate among population between the ages 20 and 24 in the United States with a correlation coefficient (R) of 0.290 and weighted average of 77.7%. Similarly, the statistical analysis conducted on geographies consisting of 325,873,529 people shows a weak negative correlation between the proportion of Immigrants from Cuba and labor force participation rate among population between the ages 20 and 24 in the United States with a correlation coefficient (R) of -0.257 and weighted average of 72.0%, a difference of 8.0%.
In Labor Force | Age 20-24 Correlation Summary
| Measurement | Slovak | Immigrants from Cuba |
| Minimum | 46.0% | 47.0% |
| Maximum | 100.0% | 91.0% |
| Range | 54.0% | 43.9% |
| Mean | 82.1% | 70.6% |
| Median | 80.8% | 72.4% |
| Interquartile 25% (IQ1) | 76.7% | 66.4% |
| Interquartile 75% (IQ3) | 86.0% | 75.7% |
| Interquartile Range (IQR) | 9.3% | 9.3% |
| Standard Deviation (Sample) | 11.1% | 8.0% |
| Standard Deviation (Population) | 11.0% | 8.0% |
Similar Demographics by In Labor Force | Age 20-24
Demographics Similar to Slovaks by In Labor Force | Age 20-24
In terms of in labor force | age 20-24, the demographic groups most similar to Slovaks are Swiss (77.7%, a difference of 0.020%), Belgian (77.8%, a difference of 0.090%), Immigrants from Micronesia (77.8%, a difference of 0.12%), Polish (77.6%, a difference of 0.14%), and English (77.6%, a difference of 0.20%).
| Demographics | Rating | Rank | In Labor Force | Age 20-24 |
| Pennsylvania Germans | 100.0 /100 | #22 | Exceptional 78.0% |
| Yugoslavians | 100.0 /100 | #23 | Exceptional 78.0% |
| Liberians | 100.0 /100 | #24 | Exceptional 78.0% |
| Tlingit-Haida | 100.0 /100 | #25 | Exceptional 77.9% |
| Tongans | 100.0 /100 | #26 | Exceptional 77.9% |
| Immigrants | Micronesia | 100.0 /100 | #27 | Exceptional 77.8% |
| Belgians | 100.0 /100 | #28 | Exceptional 77.8% |
| Slovaks | 100.0 /100 | #29 | Exceptional 77.7% |
| Swiss | 100.0 /100 | #30 | Exceptional 77.7% |
| Poles | 100.0 /100 | #31 | Exceptional 77.6% |
| English | 100.0 /100 | #32 | Exceptional 77.6% |
| Immigrants | Ethiopia | 100.0 /100 | #33 | Exceptional 77.5% |
| German Russians | 100.0 /100 | #34 | Exceptional 77.5% |
| Immigrants | Eastern Africa | 100.0 /100 | #35 | Exceptional 77.5% |
| Welsh | 100.0 /100 | #36 | Exceptional 77.5% |
Demographics Similar to Immigrants from Cuba by In Labor Force | Age 20-24
In terms of in labor force | age 20-24, the demographic groups most similar to Immigrants from Cuba are Apache (72.0%, a difference of 0.010%), Immigrants from Caribbean (71.9%, a difference of 0.080%), Immigrants from Dominica (71.9%, a difference of 0.13%), Indian (Asian) (71.9%, a difference of 0.14%), and Immigrants from Iran (71.8%, a difference of 0.22%).
| Demographics | Rating | Rank | In Labor Force | Age 20-24 |
| Ecuadorians | 0.0 /100 | #303 | Tragic 72.4% |
| Immigrants | West Indies | 0.0 /100 | #304 | Tragic 72.4% |
| Immigrants | Singapore | 0.0 /100 | #305 | Tragic 72.4% |
| Immigrants | Jamaica | 0.0 /100 | #306 | Tragic 72.4% |
| Immigrants | Ecuador | 0.0 /100 | #307 | Tragic 72.3% |
| Soviet Union | 0.0 /100 | #308 | Tragic 72.3% |
| Tsimshian | 0.0 /100 | #309 | Tragic 72.3% |
| Immigrants | Cuba | 0.0 /100 | #310 | Tragic 72.0% |
| Apache | 0.0 /100 | #311 | Tragic 72.0% |
| Immigrants | Caribbean | 0.0 /100 | #312 | Tragic 71.9% |
| Immigrants | Dominica | 0.0 /100 | #313 | Tragic 71.9% |
| Indians (Asian) | 0.0 /100 | #314 | Tragic 71.9% |
| Immigrants | Iran | 0.0 /100 | #315 | Tragic 71.8% |
| Immigrants | Eastern Asia | 0.0 /100 | #316 | Tragic 71.8% |
| Immigrants | Armenia | 0.0 /100 | #317 | Tragic 71.7% |