Puget Sound Salish vs Mongolian In Labor Force | Age 16-19
COMPARE
Puget Sound Salish
Mongolian
In Labor Force | Age 16-19
In Labor Force | Age 16-19 Comparison
Puget Sound Salish
Mongolians
39.1%
IN LABOR FORCE | AGE 16-19
99.6/ 100
METRIC RATING
88th/ 347
METRIC RANK
35.3%
IN LABOR FORCE | AGE 16-19
5.7/ 100
METRIC RATING
227th/ 347
METRIC RANK
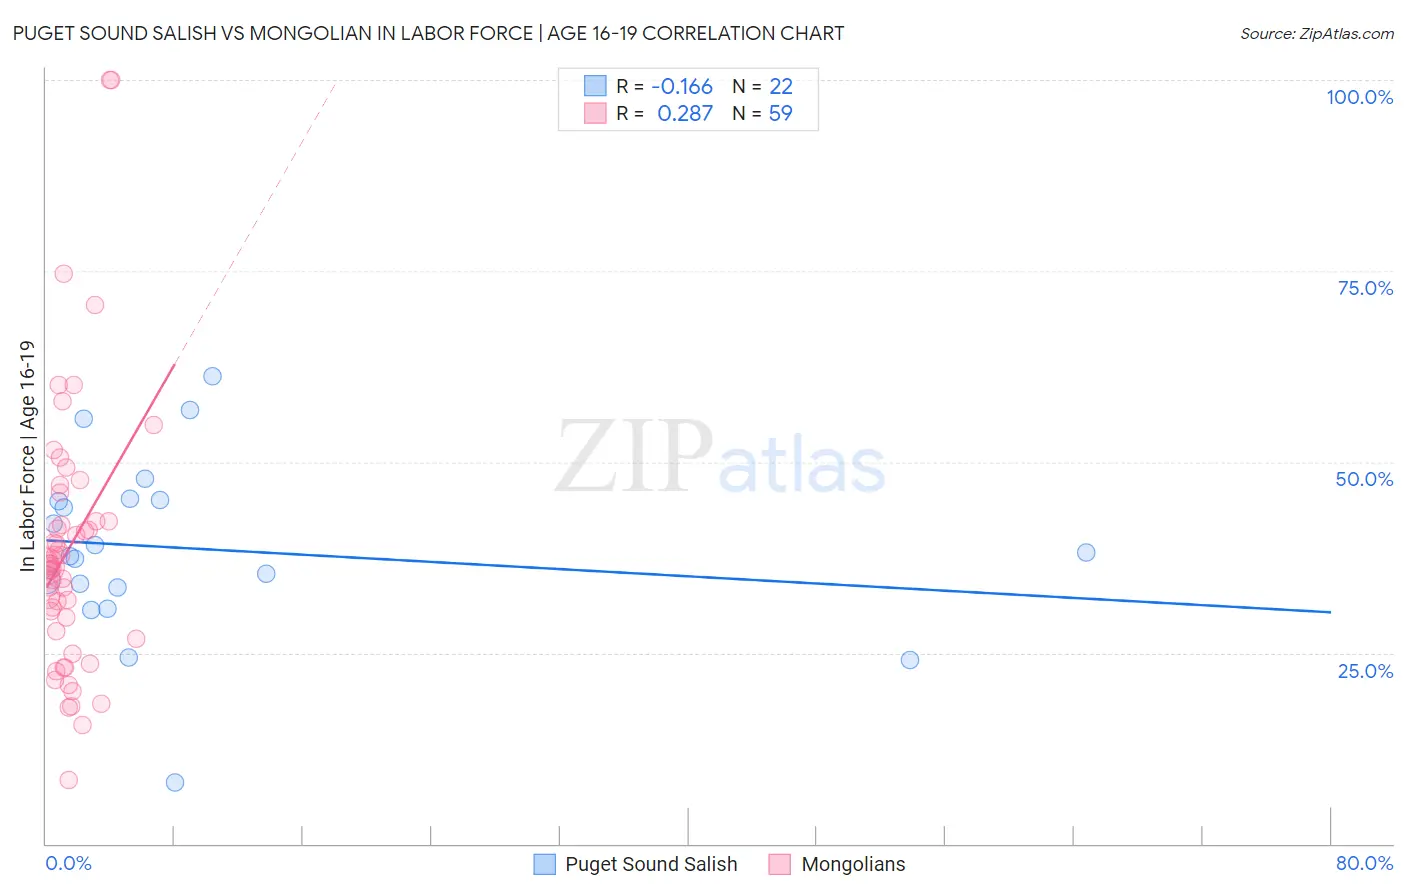
Puget Sound Salish vs Mongolian In Labor Force | Age 16-19 Correlation Chart
The statistical analysis conducted on geographies consisting of 46,131,142 people shows a poor negative correlation between the proportion of Puget Sound Salish and labor force participation rate among population between the ages 16 and 19 in the United States with a correlation coefficient (R) of -0.166 and weighted average of 39.1%. Similarly, the statistical analysis conducted on geographies consisting of 140,345,007 people shows a weak positive correlation between the proportion of Mongolians and labor force participation rate among population between the ages 16 and 19 in the United States with a correlation coefficient (R) of 0.287 and weighted average of 35.3%, a difference of 10.8%.
In Labor Force | Age 16-19 Correlation Summary
| Measurement | Puget Sound Salish | Mongolian |
| Minimum | 8.1% | 8.3% |
| Maximum | 61.2% | 100.0% |
| Range | 53.1% | 91.7% |
| Mean | 38.6% | 38.6% |
| Median | 37.8% | 36.4% |
| Interquartile 25% (IQ1) | 33.5% | 27.9% |
| Interquartile 75% (IQ3) | 45.0% | 42.3% |
| Interquartile Range (IQR) | 11.5% | 14.4% |
| Standard Deviation (Sample) | 11.8% | 17.5% |
| Standard Deviation (Population) | 11.5% | 17.3% |
Similar Demographics by In Labor Force | Age 16-19
Demographics Similar to Puget Sound Salish by In Labor Force | Age 16-19
In terms of in labor force | age 16-19, the demographic groups most similar to Puget Sound Salish are Alaska Native (39.1%, a difference of 0.010%), Immigrants from Germany (39.1%, a difference of 0.070%), Immigrants from Burma/Myanmar (39.0%, a difference of 0.090%), Samoan (39.1%, a difference of 0.16%), and Creek (39.1%, a difference of 0.17%).
| Demographics | Rating | Rank | In Labor Force | Age 16-19 |
| Shoshone | 99.7 /100 | #81 | Exceptional 39.3% |
| Basques | 99.7 /100 | #82 | Exceptional 39.3% |
| Spanish | 99.7 /100 | #83 | Exceptional 39.3% |
| Immigrants | Uganda | 99.7 /100 | #84 | Exceptional 39.2% |
| Creek | 99.6 /100 | #85 | Exceptional 39.1% |
| Samoans | 99.6 /100 | #86 | Exceptional 39.1% |
| Immigrants | Germany | 99.6 /100 | #87 | Exceptional 39.1% |
| Puget Sound Salish | 99.6 /100 | #88 | Exceptional 39.1% |
| Alaska Natives | 99.6 /100 | #89 | Exceptional 39.1% |
| Immigrants | Burma/Myanmar | 99.5 /100 | #90 | Exceptional 39.0% |
| Spanish Americans | 99.5 /100 | #91 | Exceptional 39.0% |
| Osage | 99.4 /100 | #92 | Exceptional 39.0% |
| Blackfeet | 99.4 /100 | #93 | Exceptional 38.9% |
| Immigrants | Canada | 99.4 /100 | #94 | Exceptional 38.9% |
| Immigrants | North America | 99.4 /100 | #95 | Exceptional 38.9% |
Demographics Similar to Mongolians by In Labor Force | Age 16-19
In terms of in labor force | age 16-19, the demographic groups most similar to Mongolians are Immigrants from Guatemala (35.3%, a difference of 0.010%), Immigrants from Senegal (35.3%, a difference of 0.050%), Immigrants from Belgium (35.3%, a difference of 0.10%), Honduran (35.3%, a difference of 0.18%), and Immigrants from Lebanon (35.2%, a difference of 0.18%).
| Demographics | Rating | Rank | In Labor Force | Age 16-19 |
| Immigrants | Bahamas | 8.3 /100 | #220 | Tragic 35.5% |
| Turks | 7.3 /100 | #221 | Tragic 35.4% |
| Immigrants | Ghana | 7.3 /100 | #222 | Tragic 35.4% |
| Ghanaians | 6.5 /100 | #223 | Tragic 35.3% |
| Hondurans | 6.5 /100 | #224 | Tragic 35.3% |
| Immigrants | Belgium | 6.1 /100 | #225 | Tragic 35.3% |
| Immigrants | Guatemala | 5.7 /100 | #226 | Tragic 35.3% |
| Mongolians | 5.7 /100 | #227 | Tragic 35.3% |
| Immigrants | Senegal | 5.5 /100 | #228 | Tragic 35.3% |
| Immigrants | Lebanon | 5.0 /100 | #229 | Tragic 35.2% |
| Immigrants | Honduras | 4.9 /100 | #230 | Tragic 35.2% |
| Immigrants | Syria | 4.5 /100 | #231 | Tragic 35.2% |
| Immigrants | Kazakhstan | 4.5 /100 | #232 | Tragic 35.2% |
| Immigrants | France | 4.3 /100 | #233 | Tragic 35.1% |
| Immigrants | Mexico | 4.2 /100 | #234 | Tragic 35.1% |