Turkish vs Cheyenne In Labor Force | Age 20-24
COMPARE
Turkish
Cheyenne
In Labor Force | Age 20-24
In Labor Force | Age 20-24 Comparison
Turks
Cheyenne
73.9%
IN LABOR FORCE | AGE 20-24
1.8/ 100
METRIC RATING
245th/ 347
METRIC RANK
73.4%
IN LABOR FORCE | AGE 20-24
0.2/ 100
METRIC RATING
273rd/ 347
METRIC RANK
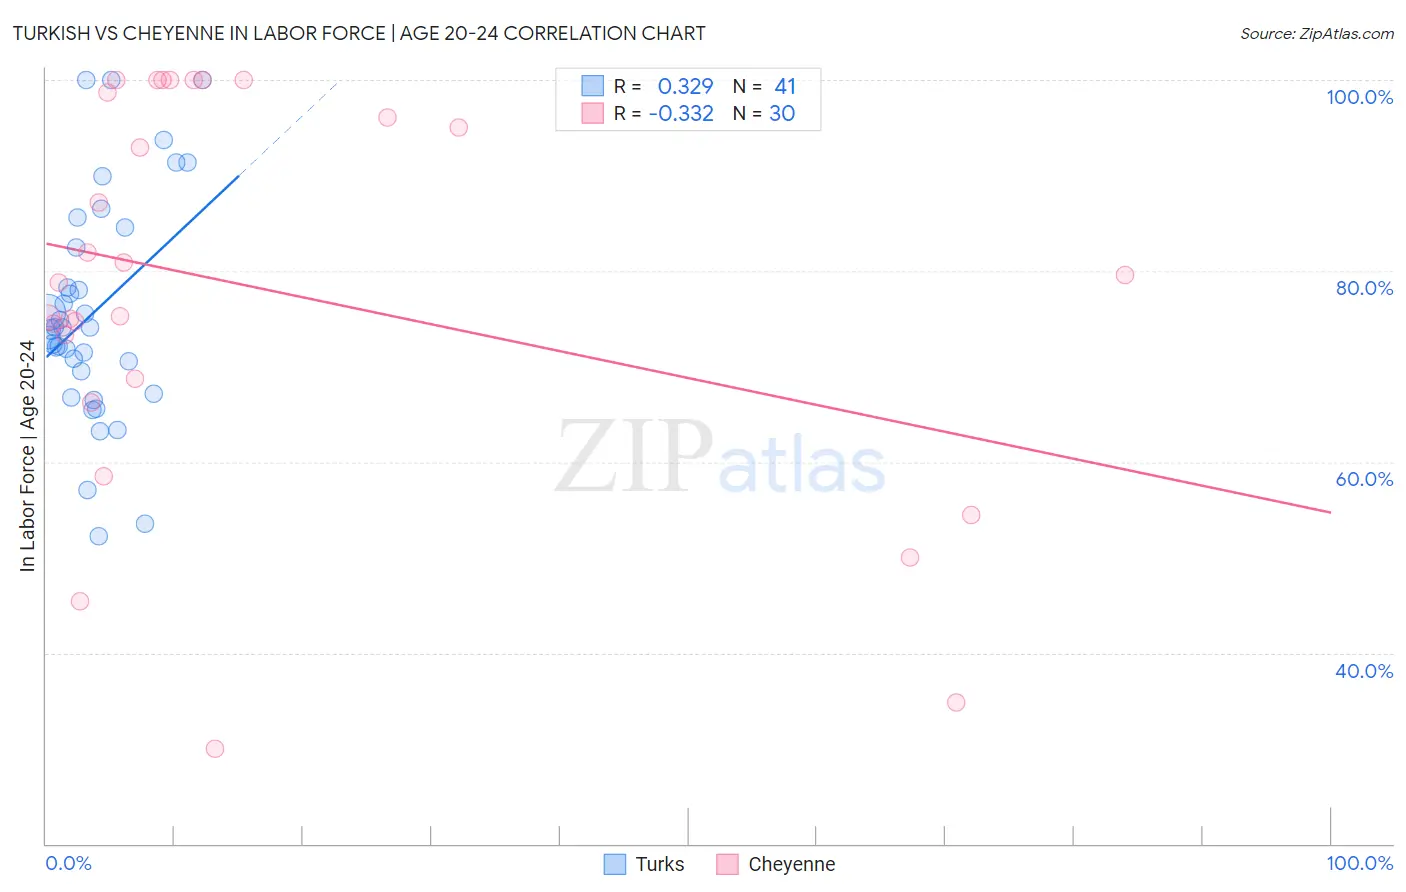
Turkish vs Cheyenne In Labor Force | Age 20-24 Correlation Chart
The statistical analysis conducted on geographies consisting of 271,784,032 people shows a mild positive correlation between the proportion of Turks and labor force participation rate among population between the ages 20 and 24 in the United States with a correlation coefficient (R) of 0.329 and weighted average of 73.9%. Similarly, the statistical analysis conducted on geographies consisting of 80,658,593 people shows a mild negative correlation between the proportion of Cheyenne and labor force participation rate among population between the ages 20 and 24 in the United States with a correlation coefficient (R) of -0.332 and weighted average of 73.4%, a difference of 0.75%.
In Labor Force | Age 20-24 Correlation Summary
| Measurement | Turkish | Cheyenne |
| Minimum | 52.3% | 30.0% |
| Maximum | 100.0% | 100.0% |
| Range | 47.7% | 70.0% |
| Mean | 75.7% | 78.2% |
| Median | 74.1% | 79.2% |
| Interquartile 25% (IQ1) | 68.3% | 68.6% |
| Interquartile 75% (IQ3) | 83.5% | 98.7% |
| Interquartile Range (IQR) | 15.2% | 30.1% |
| Standard Deviation (Sample) | 11.7% | 20.4% |
| Standard Deviation (Population) | 11.5% | 20.0% |
Similar Demographics by In Labor Force | Age 20-24
Demographics Similar to Turks by In Labor Force | Age 20-24
In terms of in labor force | age 20-24, the demographic groups most similar to Turks are Immigrants from Syria (74.0%, a difference of 0.030%), Immigrants from South Central Asia (74.0%, a difference of 0.030%), Immigrants from Panama (73.9%, a difference of 0.040%), Thai (74.0%, a difference of 0.060%), and Immigrants from Senegal (74.0%, a difference of 0.070%).
| Demographics | Rating | Rank | In Labor Force | Age 20-24 |
| Immigrants | Japan | 3.0 /100 | #238 | Tragic 74.1% |
| Immigrants | Latin America | 2.7 /100 | #239 | Tragic 74.1% |
| Immigrants | Sri Lanka | 2.3 /100 | #240 | Tragic 74.0% |
| Immigrants | Senegal | 2.1 /100 | #241 | Tragic 74.0% |
| Thais | 2.1 /100 | #242 | Tragic 74.0% |
| Immigrants | Syria | 1.9 /100 | #243 | Tragic 74.0% |
| Immigrants | South Central Asia | 1.9 /100 | #244 | Tragic 74.0% |
| Turks | 1.8 /100 | #245 | Tragic 73.9% |
| Immigrants | Panama | 1.6 /100 | #246 | Tragic 73.9% |
| Colville | 1.5 /100 | #247 | Tragic 73.9% |
| Immigrants | Saudi Arabia | 1.5 /100 | #248 | Tragic 73.9% |
| Blacks/African Americans | 1.3 /100 | #249 | Tragic 73.9% |
| Immigrants | Belgium | 1.3 /100 | #250 | Tragic 73.9% |
| Immigrants | Egypt | 1.2 /100 | #251 | Tragic 73.8% |
| Immigrants | Kazakhstan | 1.1 /100 | #252 | Tragic 73.8% |
Demographics Similar to Cheyenne by In Labor Force | Age 20-24
In terms of in labor force | age 20-24, the demographic groups most similar to Cheyenne are Immigrants from Colombia (73.4%, a difference of 0.020%), Belizean (73.4%, a difference of 0.030%), Immigrants from Indonesia (73.4%, a difference of 0.040%), Immigrants from South America (73.3%, a difference of 0.070%), and Mongolian (73.3%, a difference of 0.080%).
| Demographics | Rating | Rank | In Labor Force | Age 20-24 |
| Haitians | 0.5 /100 | #266 | Tragic 73.6% |
| Immigrants | Western Asia | 0.4 /100 | #267 | Tragic 73.5% |
| South Americans | 0.4 /100 | #268 | Tragic 73.5% |
| Colombians | 0.3 /100 | #269 | Tragic 73.5% |
| Immigrants | Russia | 0.3 /100 | #270 | Tragic 73.5% |
| Immigrants | Indonesia | 0.3 /100 | #271 | Tragic 73.4% |
| Belizeans | 0.3 /100 | #272 | Tragic 73.4% |
| Cheyenne | 0.2 /100 | #273 | Tragic 73.4% |
| Immigrants | Colombia | 0.2 /100 | #274 | Tragic 73.4% |
| Immigrants | South America | 0.2 /100 | #275 | Tragic 73.3% |
| Mongolians | 0.2 /100 | #276 | Tragic 73.3% |
| Immigrants | Malaysia | 0.2 /100 | #277 | Tragic 73.3% |
| Cypriots | 0.2 /100 | #278 | Tragic 73.3% |
| Venezuelans | 0.2 /100 | #279 | Tragic 73.3% |
| Bahamians | 0.1 /100 | #280 | Tragic 73.3% |