Turkish vs Yup'ik In Labor Force | Age 20-24
COMPARE
Turkish
Yup'ik
In Labor Force | Age 20-24
In Labor Force | Age 20-24 Comparison
Turks
Yup'ik
73.9%
IN LABOR FORCE | AGE 20-24
1.8/ 100
METRIC RATING
245th/ 347
METRIC RANK
70.9%
IN LABOR FORCE | AGE 20-24
0.0/ 100
METRIC RATING
329th/ 347
METRIC RANK
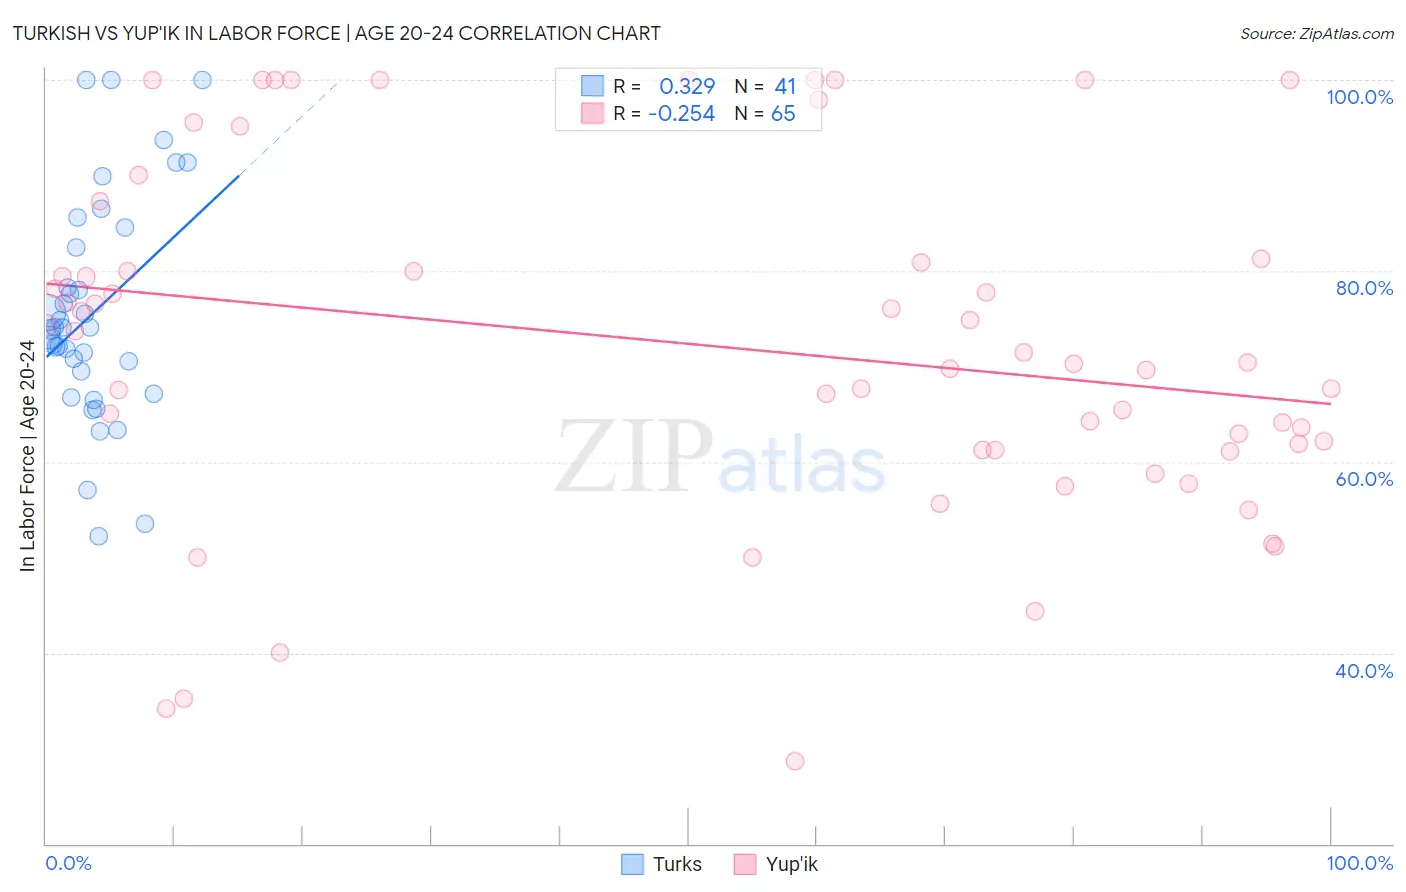
Turkish vs Yup'ik In Labor Force | Age 20-24 Correlation Chart
The statistical analysis conducted on geographies consisting of 271,784,032 people shows a mild positive correlation between the proportion of Turks and labor force participation rate among population between the ages 20 and 24 in the United States with a correlation coefficient (R) of 0.329 and weighted average of 73.9%. Similarly, the statistical analysis conducted on geographies consisting of 39,958,192 people shows a weak negative correlation between the proportion of Yup'ik and labor force participation rate among population between the ages 20 and 24 in the United States with a correlation coefficient (R) of -0.254 and weighted average of 70.9%, a difference of 4.3%.
In Labor Force | Age 20-24 Correlation Summary
| Measurement | Turkish | Yup'ik |
| Minimum | 52.3% | 28.6% |
| Maximum | 100.0% | 100.0% |
| Range | 47.7% | 71.4% |
| Mean | 75.7% | 72.2% |
| Median | 74.1% | 70.4% |
| Interquartile 25% (IQ1) | 68.3% | 61.3% |
| Interquartile 75% (IQ3) | 83.5% | 81.1% |
| Interquartile Range (IQR) | 15.2% | 19.8% |
| Standard Deviation (Sample) | 11.7% | 18.2% |
| Standard Deviation (Population) | 11.5% | 18.1% |
Similar Demographics by In Labor Force | Age 20-24
Demographics Similar to Turks by In Labor Force | Age 20-24
In terms of in labor force | age 20-24, the demographic groups most similar to Turks are Immigrants from Syria (74.0%, a difference of 0.030%), Immigrants from South Central Asia (74.0%, a difference of 0.030%), Immigrants from Panama (73.9%, a difference of 0.040%), Thai (74.0%, a difference of 0.060%), and Immigrants from Senegal (74.0%, a difference of 0.070%).
| Demographics | Rating | Rank | In Labor Force | Age 20-24 |
| Immigrants | Japan | 3.0 /100 | #238 | Tragic 74.1% |
| Immigrants | Latin America | 2.7 /100 | #239 | Tragic 74.1% |
| Immigrants | Sri Lanka | 2.3 /100 | #240 | Tragic 74.0% |
| Immigrants | Senegal | 2.1 /100 | #241 | Tragic 74.0% |
| Thais | 2.1 /100 | #242 | Tragic 74.0% |
| Immigrants | Syria | 1.9 /100 | #243 | Tragic 74.0% |
| Immigrants | South Central Asia | 1.9 /100 | #244 | Tragic 74.0% |
| Turks | 1.8 /100 | #245 | Tragic 73.9% |
| Immigrants | Panama | 1.6 /100 | #246 | Tragic 73.9% |
| Colville | 1.5 /100 | #247 | Tragic 73.9% |
| Immigrants | Saudi Arabia | 1.5 /100 | #248 | Tragic 73.9% |
| Blacks/African Americans | 1.3 /100 | #249 | Tragic 73.9% |
| Immigrants | Belgium | 1.3 /100 | #250 | Tragic 73.9% |
| Immigrants | Egypt | 1.2 /100 | #251 | Tragic 73.8% |
| Immigrants | Kazakhstan | 1.1 /100 | #252 | Tragic 73.8% |
Demographics Similar to Yup'ik by In Labor Force | Age 20-24
In terms of in labor force | age 20-24, the demographic groups most similar to Yup'ik are Immigrants from China (71.1%, a difference of 0.24%), Dominican (71.1%, a difference of 0.26%), Immigrants from Trinidad and Tobago (71.1%, a difference of 0.26%), Barbadian (71.1%, a difference of 0.35%), and Vietnamese (70.6%, a difference of 0.35%).
| Demographics | Rating | Rank | In Labor Force | Age 20-24 |
| Filipinos | 0.0 /100 | #322 | Tragic 71.4% |
| West Indians | 0.0 /100 | #323 | Tragic 71.3% |
| Immigrants | Dominican Republic | 0.0 /100 | #324 | Tragic 71.2% |
| Barbadians | 0.0 /100 | #325 | Tragic 71.1% |
| Dominicans | 0.0 /100 | #326 | Tragic 71.1% |
| Immigrants | Trinidad and Tobago | 0.0 /100 | #327 | Tragic 71.1% |
| Immigrants | China | 0.0 /100 | #328 | Tragic 71.1% |
| Yup'ik | 0.0 /100 | #329 | Tragic 70.9% |
| Vietnamese | 0.0 /100 | #330 | Tragic 70.6% |
| Immigrants | Bangladesh | 0.0 /100 | #331 | Tragic 70.6% |
| Immigrants | Uzbekistan | 0.0 /100 | #332 | Tragic 70.4% |
| Yuman | 0.0 /100 | #333 | Tragic 70.3% |
| British West Indians | 0.0 /100 | #334 | Tragic 70.0% |
| Immigrants | Barbados | 0.0 /100 | #335 | Tragic 69.7% |
| Immigrants | Guyana | 0.0 /100 | #336 | Tragic 69.3% |