Tongan vs Indonesian In Labor Force | Age 30-34
COMPARE
Tongan
Indonesian
In Labor Force | Age 30-34
In Labor Force | Age 30-34 Comparison
Tongans
Indonesians
83.5%
IN LABOR FORCE | AGE 30-34
0.0/ 100
METRIC RATING
276th/ 347
METRIC RANK
84.3%
IN LABOR FORCE | AGE 30-34
8.8/ 100
METRIC RATING
210th/ 347
METRIC RANK
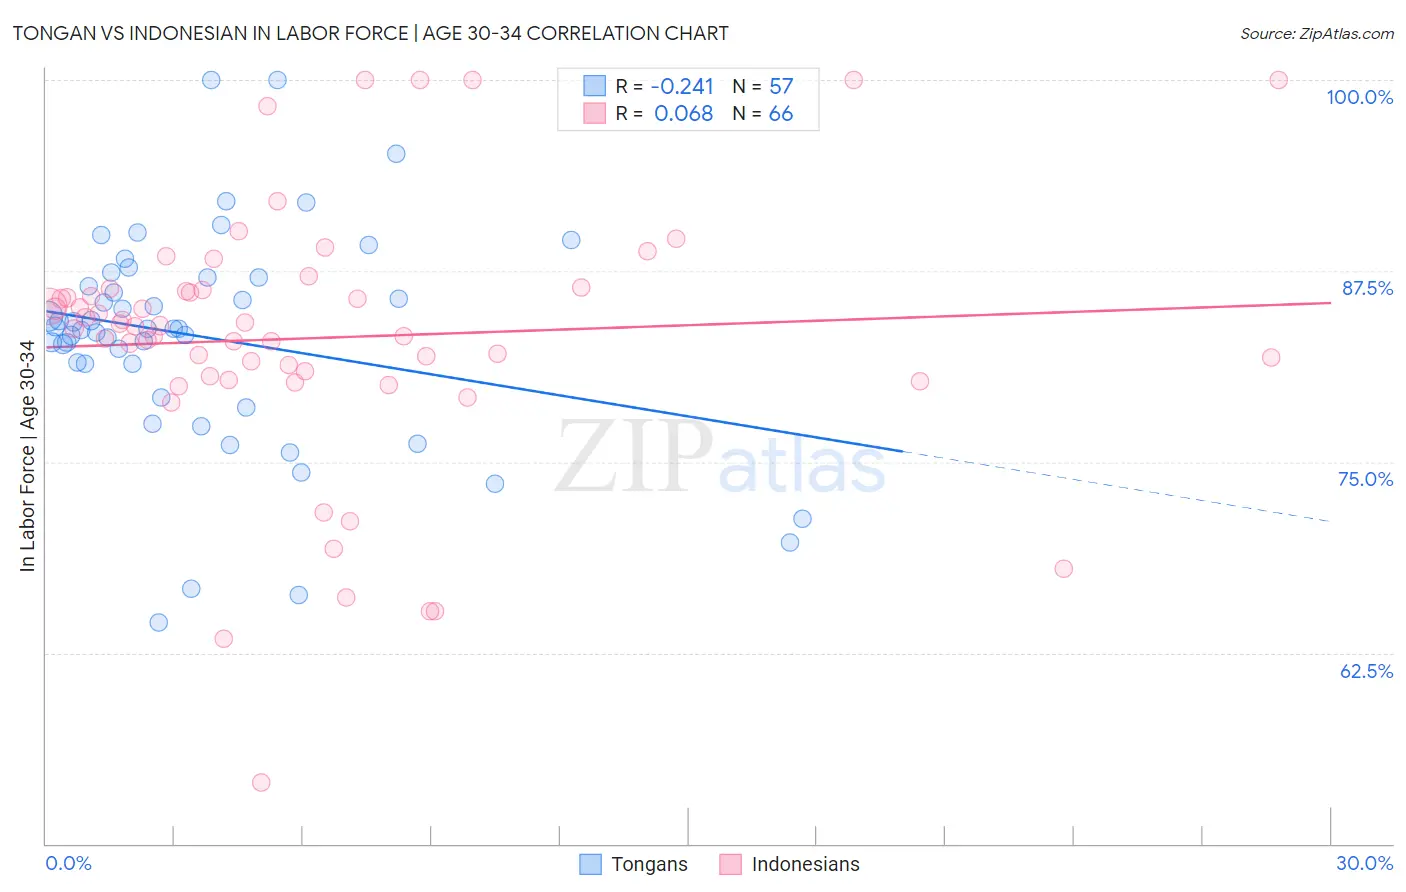
Tongan vs Indonesian In Labor Force | Age 30-34 Correlation Chart
The statistical analysis conducted on geographies consisting of 102,882,684 people shows a weak negative correlation between the proportion of Tongans and labor force participation rate among population between the ages 30 and 34 in the United States with a correlation coefficient (R) of -0.241 and weighted average of 83.5%. Similarly, the statistical analysis conducted on geographies consisting of 162,689,196 people shows a slight positive correlation between the proportion of Indonesians and labor force participation rate among population between the ages 30 and 34 in the United States with a correlation coefficient (R) of 0.068 and weighted average of 84.3%, a difference of 1.0%.
In Labor Force | Age 30-34 Correlation Summary
| Measurement | Tongan | Indonesian |
| Minimum | 64.5% | 54.0% |
| Maximum | 100.0% | 100.0% |
| Range | 35.5% | 46.0% |
| Mean | 83.2% | 83.1% |
| Median | 83.7% | 83.9% |
| Interquartile 25% (IQ1) | 80.3% | 80.6% |
| Interquartile 75% (IQ3) | 87.1% | 86.2% |
| Interquartile Range (IQR) | 6.8% | 5.6% |
| Standard Deviation (Sample) | 7.2% | 8.8% |
| Standard Deviation (Population) | 7.1% | 8.7% |
Similar Demographics by In Labor Force | Age 30-34
Demographics Similar to Tongans by In Labor Force | Age 30-34
In terms of in labor force | age 30-34, the demographic groups most similar to Tongans are Immigrants from Grenada (83.5%, a difference of 0.010%), Guamanian/Chamorro (83.5%, a difference of 0.020%), Belizean (83.5%, a difference of 0.020%), Delaware (83.5%, a difference of 0.020%), and Fijian (83.4%, a difference of 0.070%).
| Demographics | Rating | Rank | In Labor Force | Age 30-34 |
| Vietnamese | 0.1 /100 | #269 | Tragic 83.6% |
| Spanish Americans | 0.0 /100 | #270 | Tragic 83.5% |
| Spanish | 0.0 /100 | #271 | Tragic 83.5% |
| Immigrants | Nonimmigrants | 0.0 /100 | #272 | Tragic 83.5% |
| Guamanians/Chamorros | 0.0 /100 | #273 | Tragic 83.5% |
| Belizeans | 0.0 /100 | #274 | Tragic 83.5% |
| Immigrants | Grenada | 0.0 /100 | #275 | Tragic 83.5% |
| Tongans | 0.0 /100 | #276 | Tragic 83.5% |
| Delaware | 0.0 /100 | #277 | Tragic 83.5% |
| Fijians | 0.0 /100 | #278 | Tragic 83.4% |
| Immigrants | Fiji | 0.0 /100 | #279 | Tragic 83.4% |
| Africans | 0.0 /100 | #280 | Tragic 83.4% |
| Samoans | 0.0 /100 | #281 | Tragic 83.3% |
| Mexican American Indians | 0.0 /100 | #282 | Tragic 83.2% |
| Assyrians/Chaldeans/Syriacs | 0.0 /100 | #283 | Tragic 83.2% |
Demographics Similar to Indonesians by In Labor Force | Age 30-34
In terms of in labor force | age 30-34, the demographic groups most similar to Indonesians are Arab (84.3%, a difference of 0.0%), Jamaican (84.3%, a difference of 0.0%), Japanese (84.3%, a difference of 0.0%), Bangladeshi (84.3%, a difference of 0.010%), and Immigrants from Western Asia (84.3%, a difference of 0.010%).
| Demographics | Rating | Rank | In Labor Force | Age 30-34 |
| Canadians | 15.4 /100 | #203 | Poor 84.4% |
| Ecuadorians | 14.2 /100 | #204 | Poor 84.4% |
| French | 13.8 /100 | #205 | Poor 84.4% |
| Lebanese | 10.6 /100 | #206 | Poor 84.4% |
| Bangladeshis | 9.4 /100 | #207 | Tragic 84.3% |
| Arabs | 8.9 /100 | #208 | Tragic 84.3% |
| Jamaicans | 8.8 /100 | #209 | Tragic 84.3% |
| Indonesians | 8.8 /100 | #210 | Tragic 84.3% |
| Japanese | 8.8 /100 | #211 | Tragic 84.3% |
| Immigrants | Western Asia | 8.2 /100 | #212 | Tragic 84.3% |
| Immigrants | Jamaica | 7.9 /100 | #213 | Tragic 84.3% |
| Immigrants | Germany | 7.2 /100 | #214 | Tragic 84.3% |
| Europeans | 7.2 /100 | #215 | Tragic 84.3% |
| Immigrants | Ecuador | 7.1 /100 | #216 | Tragic 84.3% |
| Immigrants | Trinidad and Tobago | 7.0 /100 | #217 | Tragic 84.3% |