Syrian vs Immigrants from Cabo Verde In Labor Force | Age 20-24
COMPARE
Syrian
Immigrants from Cabo Verde
In Labor Force | Age 20-24
In Labor Force | Age 20-24 Comparison
Syrians
Immigrants from Cabo Verde
75.0%
IN LABOR FORCE | AGE 20-24
49.5/ 100
METRIC RATING
175th/ 347
METRIC RANK
78.9%
IN LABOR FORCE | AGE 20-24
100.0/ 100
METRIC RATING
8th/ 347
METRIC RANK
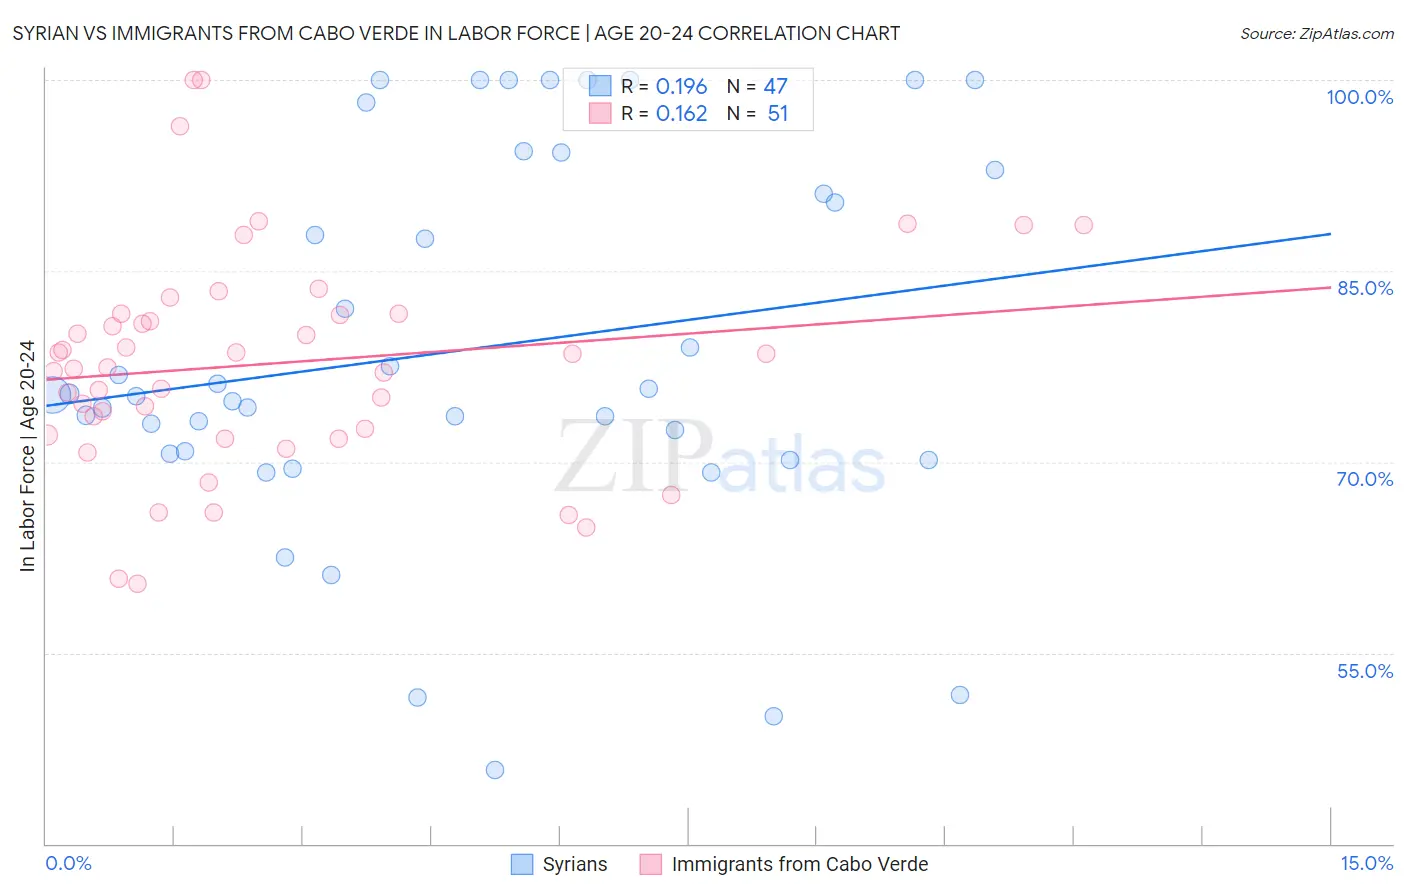
Syrian vs Immigrants from Cabo Verde In Labor Force | Age 20-24 Correlation Chart
The statistical analysis conducted on geographies consisting of 266,259,470 people shows a poor positive correlation between the proportion of Syrians and labor force participation rate among population between the ages 20 and 24 in the United States with a correlation coefficient (R) of 0.196 and weighted average of 75.0%. Similarly, the statistical analysis conducted on geographies consisting of 38,158,316 people shows a poor positive correlation between the proportion of Immigrants from Cabo Verde and labor force participation rate among population between the ages 20 and 24 in the United States with a correlation coefficient (R) of 0.162 and weighted average of 78.9%, a difference of 5.1%.
In Labor Force | Age 20-24 Correlation Summary
| Measurement | Syrian | Immigrants from Cabo Verde |
| Minimum | 45.8% | 60.5% |
| Maximum | 100.0% | 100.0% |
| Range | 54.2% | 39.5% |
| Mean | 78.8% | 77.7% |
| Median | 75.3% | 77.4% |
| Interquartile 25% (IQ1) | 70.6% | 72.1% |
| Interquartile 75% (IQ3) | 92.9% | 81.6% |
| Interquartile Range (IQR) | 22.3% | 9.5% |
| Standard Deviation (Sample) | 14.7% | 8.7% |
| Standard Deviation (Population) | 14.5% | 8.6% |
Similar Demographics by In Labor Force | Age 20-24
Demographics Similar to Syrians by In Labor Force | Age 20-24
In terms of in labor force | age 20-24, the demographic groups most similar to Syrians are Immigrants from Croatia (75.1%, a difference of 0.010%), South African (75.0%, a difference of 0.010%), Central American (75.0%, a difference of 0.010%), Cajun (75.1%, a difference of 0.020%), and Yakama (75.1%, a difference of 0.020%).
| Demographics | Rating | Rank | In Labor Force | Age 20-24 |
| Immigrants | Western Africa | 56.7 /100 | #168 | Average 75.1% |
| Immigrants | Philippines | 55.8 /100 | #169 | Average 75.1% |
| Mexicans | 52.1 /100 | #170 | Average 75.1% |
| Cajuns | 51.1 /100 | #171 | Average 75.1% |
| Yakama | 50.8 /100 | #172 | Average 75.1% |
| Immigrants | Croatia | 50.2 /100 | #173 | Average 75.1% |
| South Africans | 50.0 /100 | #174 | Average 75.0% |
| Syrians | 49.5 /100 | #175 | Average 75.0% |
| Central Americans | 48.7 /100 | #176 | Average 75.0% |
| Immigrants | Mexico | 47.8 /100 | #177 | Average 75.0% |
| Immigrants | Central America | 45.0 /100 | #178 | Average 75.0% |
| Immigrants | Latvia | 44.1 /100 | #179 | Average 75.0% |
| Immigrants | Czechoslovakia | 44.0 /100 | #180 | Average 75.0% |
| Africans | 42.5 /100 | #181 | Average 75.0% |
| Immigrants | South Africa | 36.9 /100 | #182 | Fair 74.9% |
Demographics Similar to Immigrants from Cabo Verde by In Labor Force | Age 20-24
In terms of in labor force | age 20-24, the demographic groups most similar to Immigrants from Cabo Verde are Swedish (78.8%, a difference of 0.070%), Luxembourger (79.0%, a difference of 0.10%), Danish (79.0%, a difference of 0.15%), Aleut (79.0%, a difference of 0.16%), and Slovene (78.7%, a difference of 0.22%).
| Demographics | Rating | Rank | In Labor Force | Age 20-24 |
| Norwegians | 100.0 /100 | #1 | Exceptional 80.1% |
| Immigrants | Somalia | 100.0 /100 | #2 | Exceptional 79.5% |
| Somalis | 100.0 /100 | #3 | Exceptional 79.3% |
| Alaskan Athabascans | 100.0 /100 | #4 | Exceptional 79.1% |
| Aleuts | 100.0 /100 | #5 | Exceptional 79.0% |
| Danes | 100.0 /100 | #6 | Exceptional 79.0% |
| Luxembourgers | 100.0 /100 | #7 | Exceptional 79.0% |
| Immigrants | Cabo Verde | 100.0 /100 | #8 | Exceptional 78.9% |
| Swedes | 100.0 /100 | #9 | Exceptional 78.8% |
| Slovenes | 100.0 /100 | #10 | Exceptional 78.7% |
| Finns | 100.0 /100 | #11 | Exceptional 78.7% |
| Germans | 100.0 /100 | #12 | Exceptional 78.6% |
| Scandinavians | 100.0 /100 | #13 | Exceptional 78.5% |
| Czechs | 100.0 /100 | #14 | Exceptional 78.5% |
| Sudanese | 100.0 /100 | #15 | Exceptional 78.4% |