Swiss vs Canadian In Labor Force | Age 20-24
COMPARE
Swiss
Canadian
In Labor Force | Age 20-24
In Labor Force | Age 20-24 Comparison
Swiss
Canadians
77.7%
IN LABOR FORCE | AGE 20-24
100.0/ 100
METRIC RATING
30th/ 347
METRIC RANK
76.6%
IN LABOR FORCE | AGE 20-24
99.6/ 100
METRIC RATING
78th/ 347
METRIC RANK
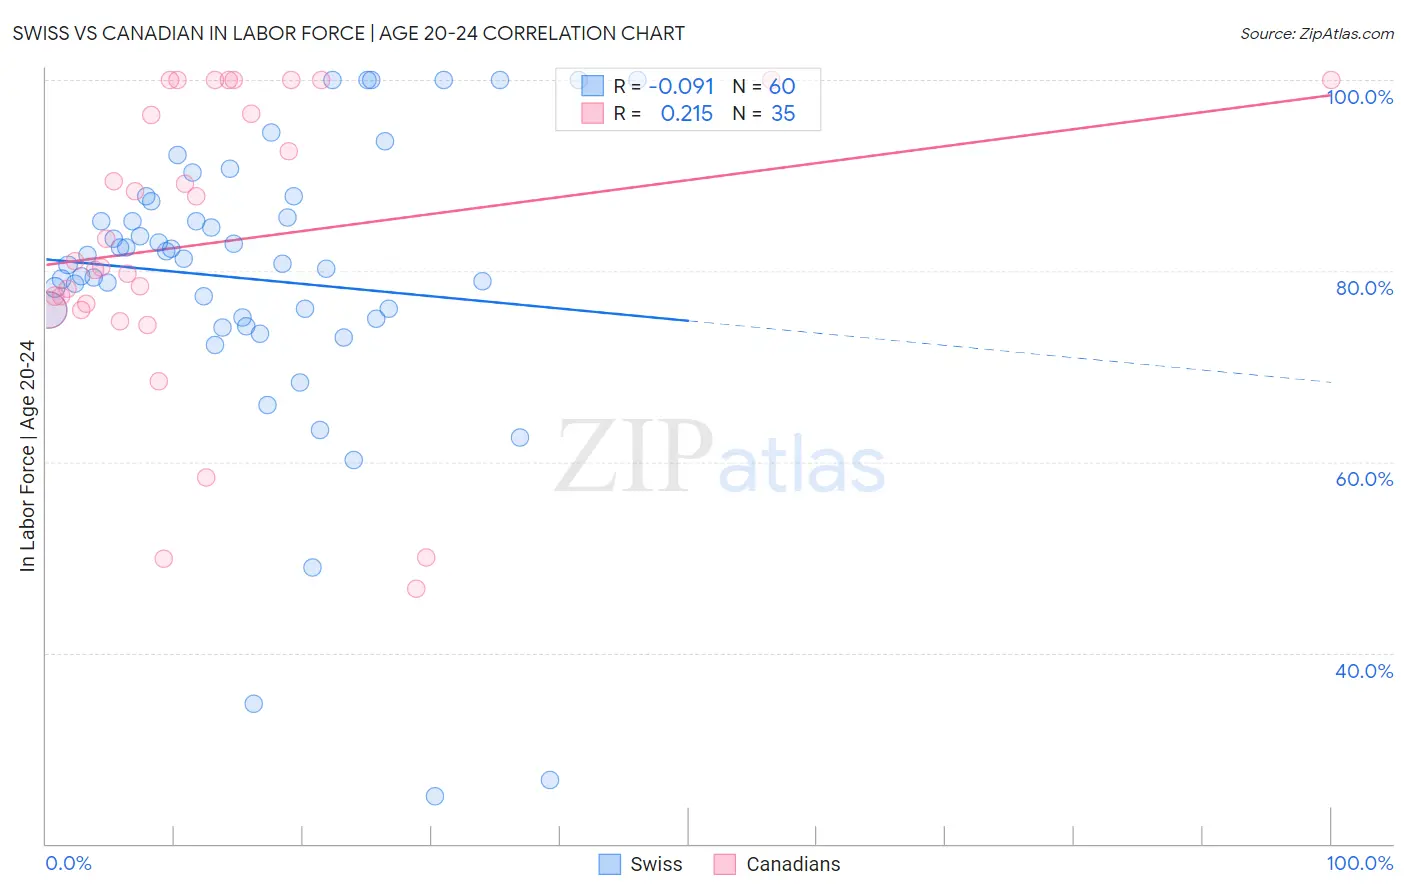
Swiss vs Canadian In Labor Force | Age 20-24 Correlation Chart
The statistical analysis conducted on geographies consisting of 464,562,174 people shows a slight negative correlation between the proportion of Swiss and labor force participation rate among population between the ages 20 and 24 in the United States with a correlation coefficient (R) of -0.091 and weighted average of 77.7%. Similarly, the statistical analysis conducted on geographies consisting of 437,221,793 people shows a weak positive correlation between the proportion of Canadians and labor force participation rate among population between the ages 20 and 24 in the United States with a correlation coefficient (R) of 0.215 and weighted average of 76.6%, a difference of 1.5%.
In Labor Force | Age 20-24 Correlation Summary
| Measurement | Swiss | Canadian |
| Minimum | 25.0% | 46.7% |
| Maximum | 100.0% | 100.0% |
| Range | 75.0% | 53.3% |
| Mean | 79.1% | 83.1% |
| Median | 81.0% | 81.1% |
| Interquartile 25% (IQ1) | 75.0% | 76.0% |
| Interquartile 75% (IQ3) | 86.5% | 100.0% |
| Interquartile Range (IQR) | 11.4% | 24.0% |
| Standard Deviation (Sample) | 15.6% | 15.3% |
| Standard Deviation (Population) | 15.5% | 15.0% |
Similar Demographics by In Labor Force | Age 20-24
Demographics Similar to Swiss by In Labor Force | Age 20-24
In terms of in labor force | age 20-24, the demographic groups most similar to Swiss are Slovak (77.7%, a difference of 0.020%), Belgian (77.8%, a difference of 0.10%), Polish (77.6%, a difference of 0.12%), Immigrants from Micronesia (77.8%, a difference of 0.14%), and English (77.6%, a difference of 0.18%).
| Demographics | Rating | Rank | In Labor Force | Age 20-24 |
| Yugoslavians | 100.0 /100 | #23 | Exceptional 78.0% |
| Liberians | 100.0 /100 | #24 | Exceptional 78.0% |
| Tlingit-Haida | 100.0 /100 | #25 | Exceptional 77.9% |
| Tongans | 100.0 /100 | #26 | Exceptional 77.9% |
| Immigrants | Micronesia | 100.0 /100 | #27 | Exceptional 77.8% |
| Belgians | 100.0 /100 | #28 | Exceptional 77.8% |
| Slovaks | 100.0 /100 | #29 | Exceptional 77.7% |
| Swiss | 100.0 /100 | #30 | Exceptional 77.7% |
| Poles | 100.0 /100 | #31 | Exceptional 77.6% |
| English | 100.0 /100 | #32 | Exceptional 77.6% |
| Immigrants | Ethiopia | 100.0 /100 | #33 | Exceptional 77.5% |
| German Russians | 100.0 /100 | #34 | Exceptional 77.5% |
| Immigrants | Eastern Africa | 100.0 /100 | #35 | Exceptional 77.5% |
| Welsh | 100.0 /100 | #36 | Exceptional 77.5% |
| Czechoslovakians | 100.0 /100 | #37 | Exceptional 77.5% |
Demographics Similar to Canadians by In Labor Force | Age 20-24
In terms of in labor force | age 20-24, the demographic groups most similar to Canadians are Immigrants from Cameroon (76.6%, a difference of 0.0%), Immigrants from Zaire (76.6%, a difference of 0.020%), Immigrants from Moldova (76.6%, a difference of 0.040%), Italian (76.5%, a difference of 0.050%), and Basque (76.5%, a difference of 0.060%).
| Demographics | Rating | Rank | In Labor Force | Age 20-24 |
| Northern Europeans | 99.8 /100 | #71 | Exceptional 76.8% |
| Guamanians/Chamorros | 99.8 /100 | #72 | Exceptional 76.7% |
| British | 99.8 /100 | #73 | Exceptional 76.7% |
| Cree | 99.7 /100 | #74 | Exceptional 76.6% |
| Immigrants | Middle Africa | 99.7 /100 | #75 | Exceptional 76.6% |
| Immigrants | Moldova | 99.6 /100 | #76 | Exceptional 76.6% |
| Immigrants | Cameroon | 99.6 /100 | #77 | Exceptional 76.6% |
| Canadians | 99.6 /100 | #78 | Exceptional 76.6% |
| Immigrants | Zaire | 99.6 /100 | #79 | Exceptional 76.6% |
| Italians | 99.6 /100 | #80 | Exceptional 76.5% |
| Basques | 99.5 /100 | #81 | Exceptional 76.5% |
| Hmong | 99.5 /100 | #82 | Exceptional 76.5% |
| Carpatho Rusyns | 99.4 /100 | #83 | Exceptional 76.5% |
| Austrians | 99.4 /100 | #84 | Exceptional 76.5% |
| Portuguese | 99.3 /100 | #85 | Exceptional 76.4% |