Immigrants from Japan vs Tsimshian In Labor Force | Age 25-29
COMPARE
Immigrants from Japan
Tsimshian
In Labor Force | Age 25-29
In Labor Force | Age 25-29 Comparison
Immigrants from Japan
Tsimshian
85.1%
IN LABOR FORCE | AGE 25-29
93.5/ 100
METRIC RATING
103rd/ 347
METRIC RANK
88.7%
IN LABOR FORCE | AGE 25-29
100.0/ 100
METRIC RATING
1st/ 347
METRIC RANK
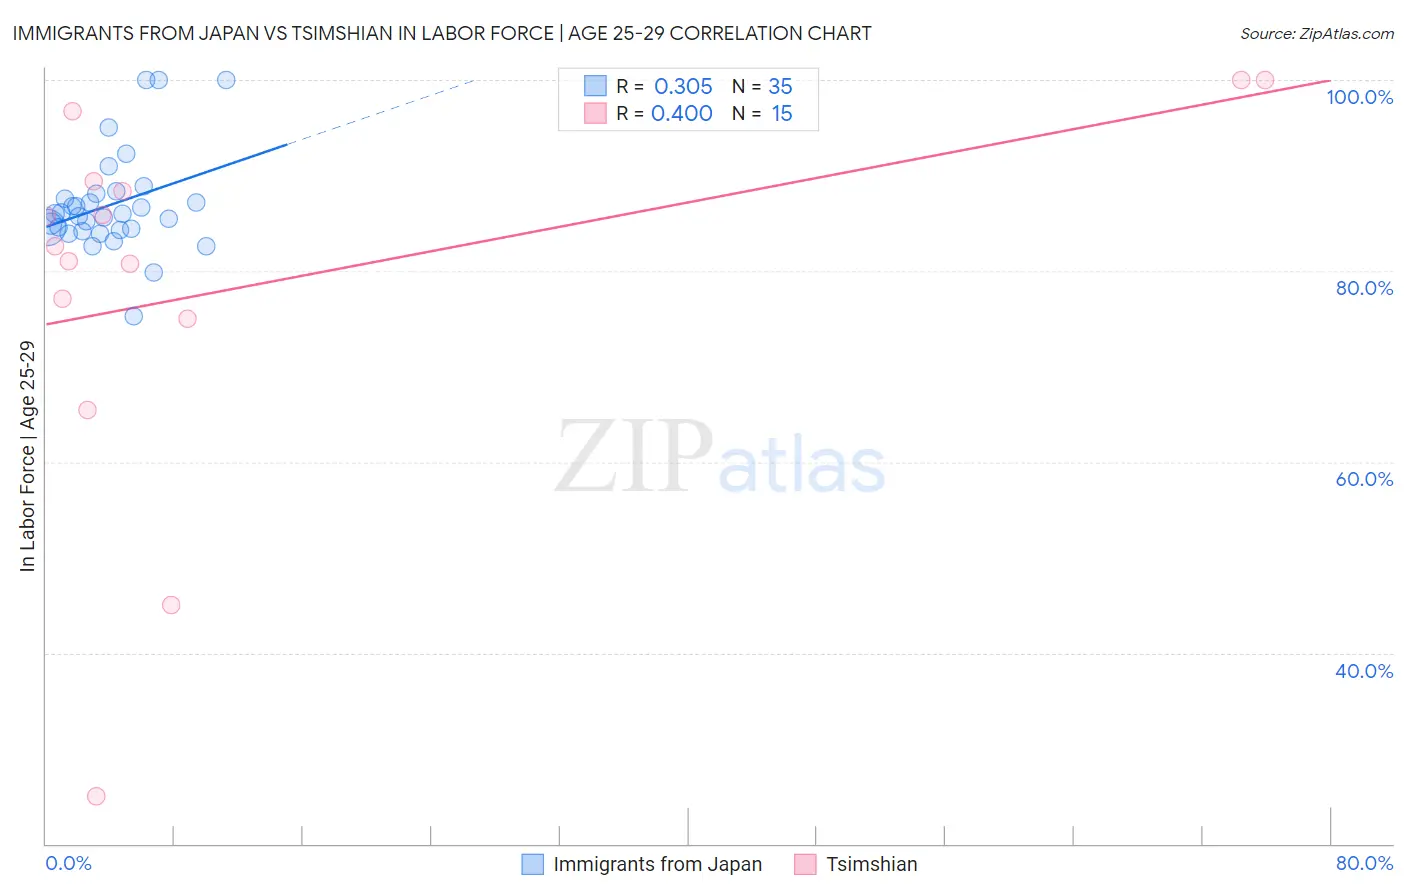
Immigrants from Japan vs Tsimshian In Labor Force | Age 25-29 Correlation Chart
The statistical analysis conducted on geographies consisting of 340,047,013 people shows a mild positive correlation between the proportion of Immigrants from Japan and labor force participation rate among population between the ages 25 and 29 in the United States with a correlation coefficient (R) of 0.305 and weighted average of 85.1%. Similarly, the statistical analysis conducted on geographies consisting of 15,624,837 people shows a mild positive correlation between the proportion of Tsimshian and labor force participation rate among population between the ages 25 and 29 in the United States with a correlation coefficient (R) of 0.400 and weighted average of 88.7%, a difference of 4.2%.
In Labor Force | Age 25-29 Correlation Summary
| Measurement | Immigrants from Japan | Tsimshian |
| Minimum | 75.2% | 25.0% |
| Maximum | 100.0% | 100.0% |
| Range | 24.8% | 75.0% |
| Mean | 87.0% | 78.5% |
| Median | 85.9% | 82.5% |
| Interquartile 25% (IQ1) | 84.3% | 75.0% |
| Interquartile 75% (IQ3) | 88.1% | 89.4% |
| Interquartile Range (IQR) | 3.8% | 14.4% |
| Standard Deviation (Sample) | 5.3% | 20.3% |
| Standard Deviation (Population) | 5.2% | 19.6% |
Similar Demographics by In Labor Force | Age 25-29
Demographics Similar to Immigrants from Japan by In Labor Force | Age 25-29
In terms of in labor force | age 25-29, the demographic groups most similar to Immigrants from Japan are Bangladeshi (85.1%, a difference of 0.010%), Immigrants from Switzerland (85.1%, a difference of 0.010%), Egyptian (85.1%, a difference of 0.010%), Slavic (85.1%, a difference of 0.010%), and Immigrants from Zaire (85.1%, a difference of 0.010%).
| Demographics | Rating | Rank | In Labor Force | Age 25-29 |
| Immigrants | Romania | 94.6 /100 | #96 | Exceptional 85.1% |
| Immigrants | Sudan | 94.3 /100 | #97 | Exceptional 85.1% |
| Mongolians | 94.1 /100 | #98 | Exceptional 85.1% |
| Bangladeshis | 94.0 /100 | #99 | Exceptional 85.1% |
| Immigrants | Switzerland | 93.9 /100 | #100 | Exceptional 85.1% |
| Egyptians | 93.8 /100 | #101 | Exceptional 85.1% |
| Slavs | 93.7 /100 | #102 | Exceptional 85.1% |
| Immigrants | Japan | 93.5 /100 | #103 | Exceptional 85.1% |
| Immigrants | Zaire | 93.3 /100 | #104 | Exceptional 85.1% |
| Immigrants | Hong Kong | 92.8 /100 | #105 | Exceptional 85.0% |
| Czechoslovakians | 92.6 /100 | #106 | Exceptional 85.0% |
| Immigrants | Southern Europe | 92.3 /100 | #107 | Exceptional 85.0% |
| Immigrants | Austria | 91.9 /100 | #108 | Exceptional 85.0% |
| Costa Ricans | 91.9 /100 | #109 | Exceptional 85.0% |
| New Zealanders | 91.5 /100 | #110 | Exceptional 85.0% |
Demographics Similar to Tsimshian by In Labor Force | Age 25-29
In terms of in labor force | age 25-29, the demographic groups most similar to Tsimshian are Immigrants from Somalia (87.1%, a difference of 1.8%), Somali (87.1%, a difference of 1.8%), Carpatho Rusyn (87.0%, a difference of 1.9%), Luxembourger (86.9%, a difference of 2.0%), and Slovene (86.4%, a difference of 2.7%).
| Demographics | Rating | Rank | In Labor Force | Age 25-29 |
| Tsimshian | 100.0 /100 | #1 | Exceptional 88.7% |
| Immigrants | Somalia | 100.0 /100 | #2 | Exceptional 87.1% |
| Somalis | 100.0 /100 | #3 | Exceptional 87.1% |
| Carpatho Rusyns | 100.0 /100 | #4 | Exceptional 87.0% |
| Luxembourgers | 100.0 /100 | #5 | Exceptional 86.9% |
| Slovenes | 100.0 /100 | #6 | Exceptional 86.4% |
| Immigrants | Bosnia and Herzegovina | 100.0 /100 | #7 | Exceptional 86.3% |
| Immigrants | Cabo Verde | 100.0 /100 | #8 | Exceptional 86.2% |
| Ethiopians | 100.0 /100 | #9 | Exceptional 86.2% |
| Liberians | 100.0 /100 | #10 | Exceptional 86.1% |
| Immigrants | Ethiopia | 100.0 /100 | #11 | Exceptional 86.1% |
| Immigrants | Lithuania | 100.0 /100 | #12 | Exceptional 86.1% |
| Norwegians | 100.0 /100 | #13 | Exceptional 86.1% |
| Latvians | 100.0 /100 | #14 | Exceptional 86.1% |
| Bolivians | 100.0 /100 | #15 | Exceptional 86.1% |