Immigrants from Eastern Europe vs Tsimshian In Labor Force | Age 25-29
COMPARE
Immigrants from Eastern Europe
Tsimshian
In Labor Force | Age 25-29
In Labor Force | Age 25-29 Comparison
Immigrants from Eastern Europe
Tsimshian
85.2%
IN LABOR FORCE | AGE 25-29
96.8/ 100
METRIC RATING
84th/ 347
METRIC RANK
88.7%
IN LABOR FORCE | AGE 25-29
100.0/ 100
METRIC RATING
1st/ 347
METRIC RANK
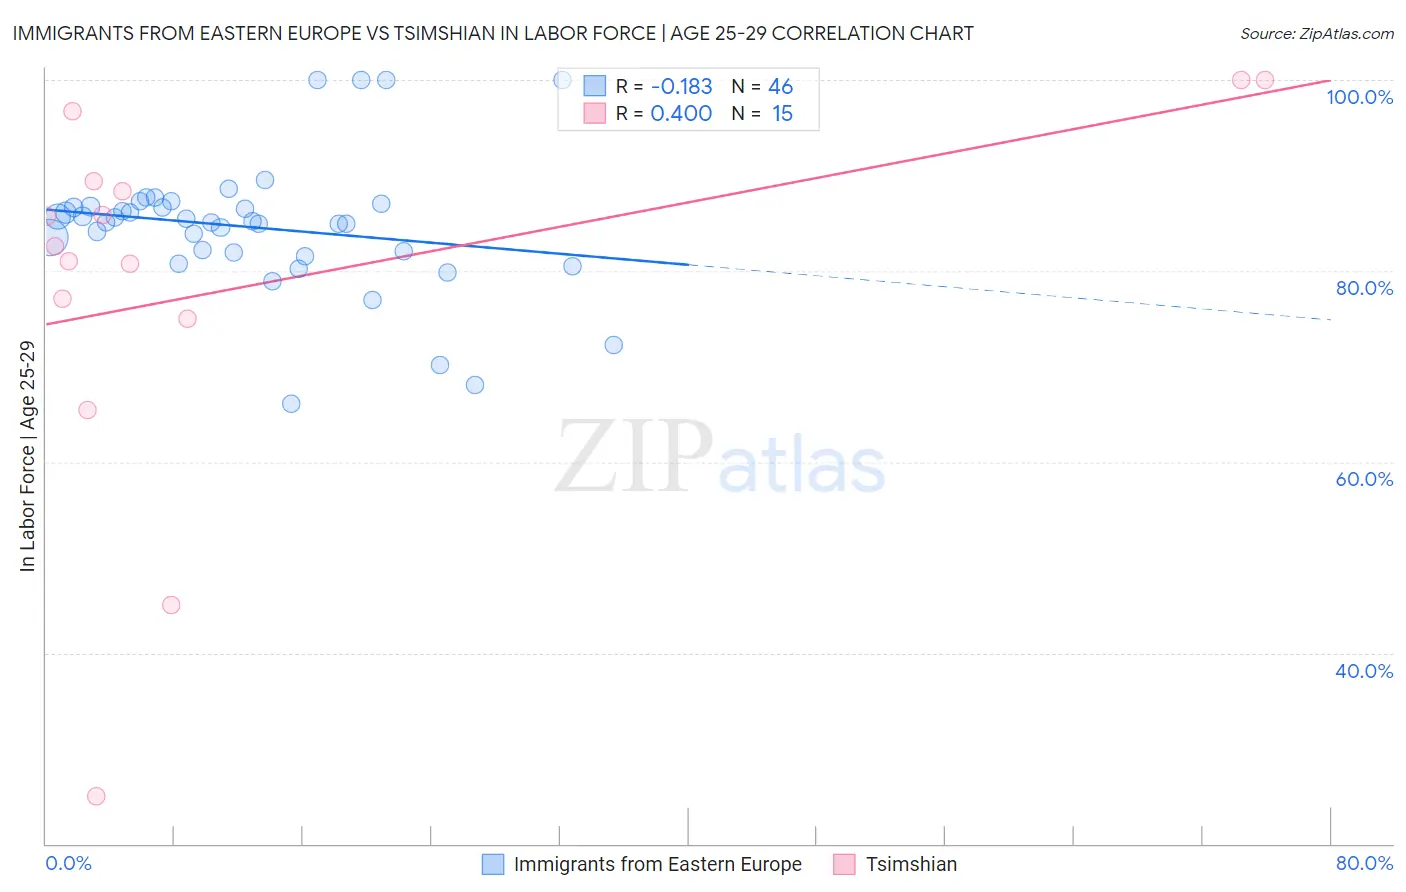
Immigrants from Eastern Europe vs Tsimshian In Labor Force | Age 25-29 Correlation Chart
The statistical analysis conducted on geographies consisting of 475,521,938 people shows a poor negative correlation between the proportion of Immigrants from Eastern Europe and labor force participation rate among population between the ages 25 and 29 in the United States with a correlation coefficient (R) of -0.183 and weighted average of 85.2%. Similarly, the statistical analysis conducted on geographies consisting of 15,624,837 people shows a mild positive correlation between the proportion of Tsimshian and labor force participation rate among population between the ages 25 and 29 in the United States with a correlation coefficient (R) of 0.400 and weighted average of 88.7%, a difference of 4.1%.
In Labor Force | Age 25-29 Correlation Summary
| Measurement | Immigrants from Eastern Europe | Tsimshian |
| Minimum | 66.0% | 25.0% |
| Maximum | 100.0% | 100.0% |
| Range | 34.0% | 75.0% |
| Mean | 84.6% | 78.5% |
| Median | 85.2% | 82.5% |
| Interquartile 25% (IQ1) | 81.9% | 75.0% |
| Interquartile 75% (IQ3) | 86.7% | 89.4% |
| Interquartile Range (IQR) | 4.8% | 14.4% |
| Standard Deviation (Sample) | 7.0% | 20.3% |
| Standard Deviation (Population) | 7.0% | 19.6% |
Similar Demographics by In Labor Force | Age 25-29
Demographics Similar to Immigrants from Eastern Europe by In Labor Force | Age 25-29
In terms of in labor force | age 25-29, the demographic groups most similar to Immigrants from Eastern Europe are Immigrants from Europe (85.2%, a difference of 0.0%), Immigrants from Africa (85.2%, a difference of 0.0%), Okinawan (85.2%, a difference of 0.010%), Ukrainian (85.2%, a difference of 0.010%), and French Canadian (85.2%, a difference of 0.010%).
| Demographics | Rating | Rank | In Labor Force | Age 25-29 |
| Immigrants | South Central Asia | 97.9 /100 | #77 | Exceptional 85.2% |
| Immigrants | Egypt | 97.7 /100 | #78 | Exceptional 85.2% |
| Immigrants | Northern Africa | 97.6 /100 | #79 | Exceptional 85.2% |
| Immigrants | Zimbabwe | 97.6 /100 | #80 | Exceptional 85.2% |
| Immigrants | Northern Europe | 97.2 /100 | #81 | Exceptional 85.2% |
| Okinawans | 97.0 /100 | #82 | Exceptional 85.2% |
| Immigrants | Europe | 96.8 /100 | #83 | Exceptional 85.2% |
| Immigrants | Eastern Europe | 96.8 /100 | #84 | Exceptional 85.2% |
| Immigrants | Africa | 96.7 /100 | #85 | Exceptional 85.2% |
| Ukrainians | 96.7 /100 | #86 | Exceptional 85.2% |
| French Canadians | 96.5 /100 | #87 | Exceptional 85.2% |
| Immigrants | Croatia | 96.4 /100 | #88 | Exceptional 85.2% |
| Immigrants | France | 96.3 /100 | #89 | Exceptional 85.2% |
| Burmese | 95.9 /100 | #90 | Exceptional 85.1% |
| Immigrants | Moldova | 95.8 /100 | #91 | Exceptional 85.1% |
Demographics Similar to Tsimshian by In Labor Force | Age 25-29
In terms of in labor force | age 25-29, the demographic groups most similar to Tsimshian are Immigrants from Somalia (87.1%, a difference of 1.8%), Somali (87.1%, a difference of 1.8%), Carpatho Rusyn (87.0%, a difference of 1.9%), Luxembourger (86.9%, a difference of 2.0%), and Slovene (86.4%, a difference of 2.7%).
| Demographics | Rating | Rank | In Labor Force | Age 25-29 |
| Tsimshian | 100.0 /100 | #1 | Exceptional 88.7% |
| Immigrants | Somalia | 100.0 /100 | #2 | Exceptional 87.1% |
| Somalis | 100.0 /100 | #3 | Exceptional 87.1% |
| Carpatho Rusyns | 100.0 /100 | #4 | Exceptional 87.0% |
| Luxembourgers | 100.0 /100 | #5 | Exceptional 86.9% |
| Slovenes | 100.0 /100 | #6 | Exceptional 86.4% |
| Immigrants | Bosnia and Herzegovina | 100.0 /100 | #7 | Exceptional 86.3% |
| Immigrants | Cabo Verde | 100.0 /100 | #8 | Exceptional 86.2% |
| Ethiopians | 100.0 /100 | #9 | Exceptional 86.2% |
| Liberians | 100.0 /100 | #10 | Exceptional 86.1% |
| Immigrants | Ethiopia | 100.0 /100 | #11 | Exceptional 86.1% |
| Immigrants | Lithuania | 100.0 /100 | #12 | Exceptional 86.1% |
| Norwegians | 100.0 /100 | #13 | Exceptional 86.1% |
| Latvians | 100.0 /100 | #14 | Exceptional 86.1% |
| Bolivians | 100.0 /100 | #15 | Exceptional 86.1% |