Sudanese vs Swedish In Labor Force | Age 25-29
COMPARE
Sudanese
Swedish
In Labor Force | Age 25-29
In Labor Force | Age 25-29 Comparison
Sudanese
Swedes
85.9%
IN LABOR FORCE | AGE 25-29
100.0/ 100
METRIC RATING
25th/ 347
METRIC RANK
85.6%
IN LABOR FORCE | AGE 25-29
99.8/ 100
METRIC RATING
49th/ 347
METRIC RANK
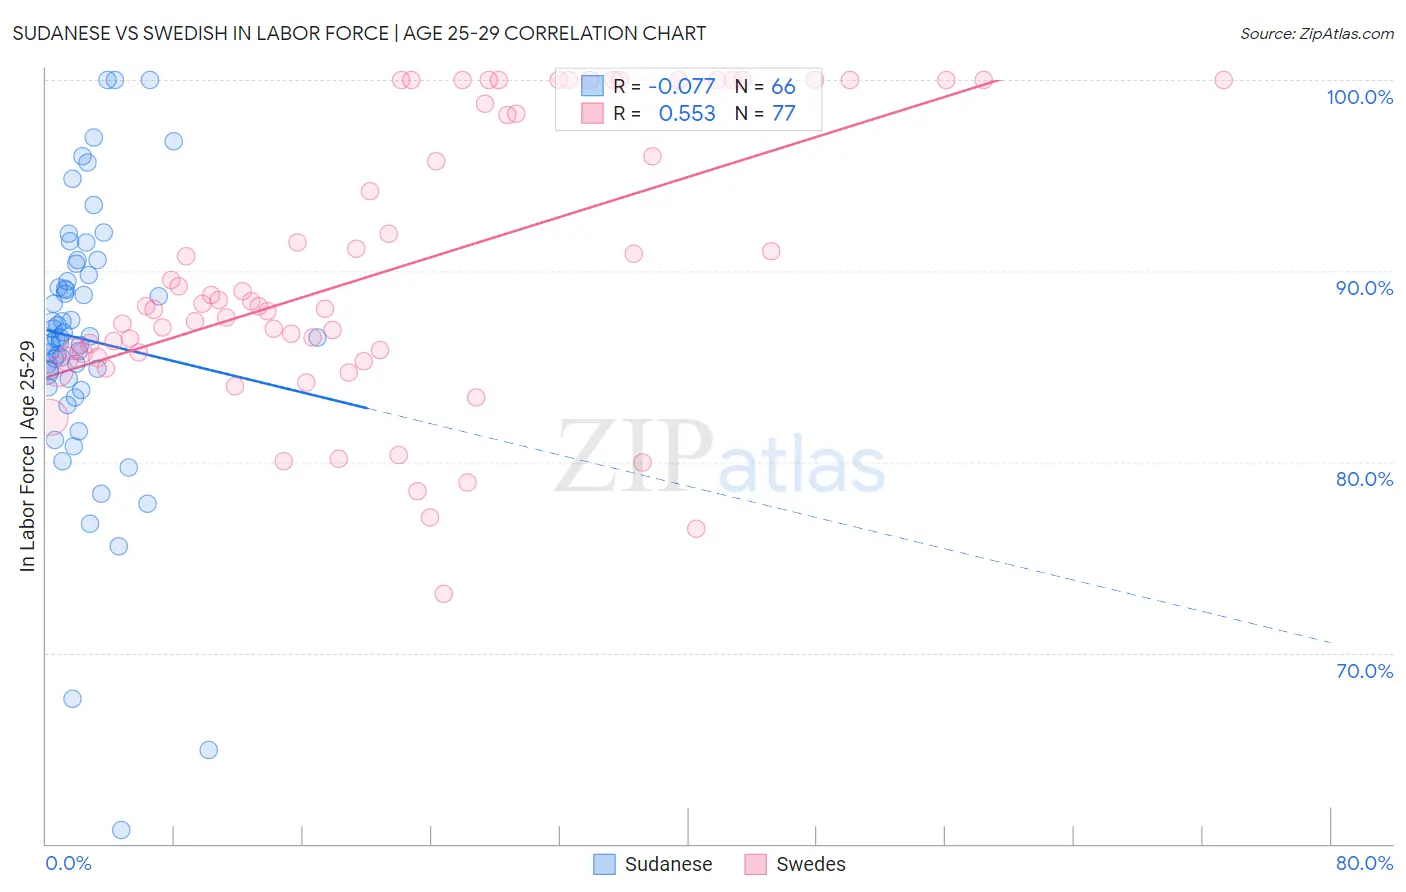
Sudanese vs Swedish In Labor Force | Age 25-29 Correlation Chart
The statistical analysis conducted on geographies consisting of 110,131,704 people shows a slight negative correlation between the proportion of Sudanese and labor force participation rate among population between the ages 25 and 29 in the United States with a correlation coefficient (R) of -0.077 and weighted average of 85.9%. Similarly, the statistical analysis conducted on geographies consisting of 538,345,964 people shows a substantial positive correlation between the proportion of Swedes and labor force participation rate among population between the ages 25 and 29 in the United States with a correlation coefficient (R) of 0.553 and weighted average of 85.6%, a difference of 0.39%.
In Labor Force | Age 25-29 Correlation Summary
| Measurement | Sudanese | Swedish |
| Minimum | 60.7% | 73.1% |
| Maximum | 100.0% | 100.0% |
| Range | 39.3% | 26.9% |
| Mean | 86.4% | 90.1% |
| Median | 86.5% | 88.2% |
| Interquartile 25% (IQ1) | 84.3% | 85.6% |
| Interquartile 75% (IQ3) | 89.8% | 99.4% |
| Interquartile Range (IQR) | 5.5% | 13.8% |
| Standard Deviation (Sample) | 7.2% | 7.3% |
| Standard Deviation (Population) | 7.1% | 7.2% |
Similar Demographics by In Labor Force | Age 25-29
Demographics Similar to Sudanese by In Labor Force | Age 25-29
In terms of in labor force | age 25-29, the demographic groups most similar to Sudanese are Immigrants from Eastern Africa (86.0%, a difference of 0.010%), Immigrants from Uganda (86.0%, a difference of 0.020%), Cambodian (86.0%, a difference of 0.040%), Maltese (86.0%, a difference of 0.050%), and Immigrants from Ireland (86.0%, a difference of 0.060%).
| Demographics | Rating | Rank | In Labor Force | Age 25-29 |
| Bulgarians | 100.0 /100 | #18 | Exceptional 86.0% |
| Cape Verdeans | 100.0 /100 | #19 | Exceptional 86.0% |
| Immigrants | Ireland | 100.0 /100 | #20 | Exceptional 86.0% |
| Maltese | 100.0 /100 | #21 | Exceptional 86.0% |
| Cambodians | 100.0 /100 | #22 | Exceptional 86.0% |
| Immigrants | Uganda | 100.0 /100 | #23 | Exceptional 86.0% |
| Immigrants | Eastern Africa | 100.0 /100 | #24 | Exceptional 86.0% |
| Sudanese | 100.0 /100 | #25 | Exceptional 85.9% |
| Immigrants | North Macedonia | 100.0 /100 | #26 | Exceptional 85.9% |
| Paraguayans | 100.0 /100 | #27 | Exceptional 85.9% |
| Ugandans | 100.0 /100 | #28 | Exceptional 85.9% |
| Immigrants | Liberia | 100.0 /100 | #29 | Exceptional 85.9% |
| Immigrants | Serbia | 100.0 /100 | #30 | Exceptional 85.9% |
| German Russians | 100.0 /100 | #31 | Exceptional 85.8% |
| Slovaks | 100.0 /100 | #32 | Exceptional 85.8% |
Demographics Similar to Swedes by In Labor Force | Age 25-29
In terms of in labor force | age 25-29, the demographic groups most similar to Swedes are Italian (85.6%, a difference of 0.010%), Turkish (85.6%, a difference of 0.020%), Yugoslavian (85.6%, a difference of 0.030%), Immigrants from Latvia (85.6%, a difference of 0.030%), and Czech (85.6%, a difference of 0.040%).
| Demographics | Rating | Rank | In Labor Force | Age 25-29 |
| Immigrants | Eritrea | 99.9 /100 | #42 | Exceptional 85.7% |
| Immigrants | India | 99.9 /100 | #43 | Exceptional 85.7% |
| Macedonians | 99.9 /100 | #44 | Exceptional 85.7% |
| Immigrants | Sierra Leone | 99.9 /100 | #45 | Exceptional 85.7% |
| Czechs | 99.8 /100 | #46 | Exceptional 85.6% |
| Turks | 99.8 /100 | #47 | Exceptional 85.6% |
| Italians | 99.8 /100 | #48 | Exceptional 85.6% |
| Swedes | 99.8 /100 | #49 | Exceptional 85.6% |
| Yugoslavians | 99.8 /100 | #50 | Exceptional 85.6% |
| Immigrants | Latvia | 99.8 /100 | #51 | Exceptional 85.6% |
| Immigrants | Poland | 99.7 /100 | #52 | Exceptional 85.6% |
| Belgians | 99.7 /100 | #53 | Exceptional 85.5% |
| Albanians | 99.7 /100 | #54 | Exceptional 85.5% |
| Immigrants | Brazil | 99.7 /100 | #55 | Exceptional 85.5% |
| Eastern Europeans | 99.6 /100 | #56 | Exceptional 85.5% |