Haitian vs Immigrants from Nicaragua In Labor Force | Age 30-34
COMPARE
Haitian
Immigrants from Nicaragua
In Labor Force | Age 30-34
In Labor Force | Age 30-34 Comparison
Haitians
Immigrants from Nicaragua
84.1%
IN LABOR FORCE | AGE 30-34
1.8/ 100
METRIC RATING
234th/ 347
METRIC RANK
83.9%
IN LABOR FORCE | AGE 30-34
0.6/ 100
METRIC RATING
253rd/ 347
METRIC RANK
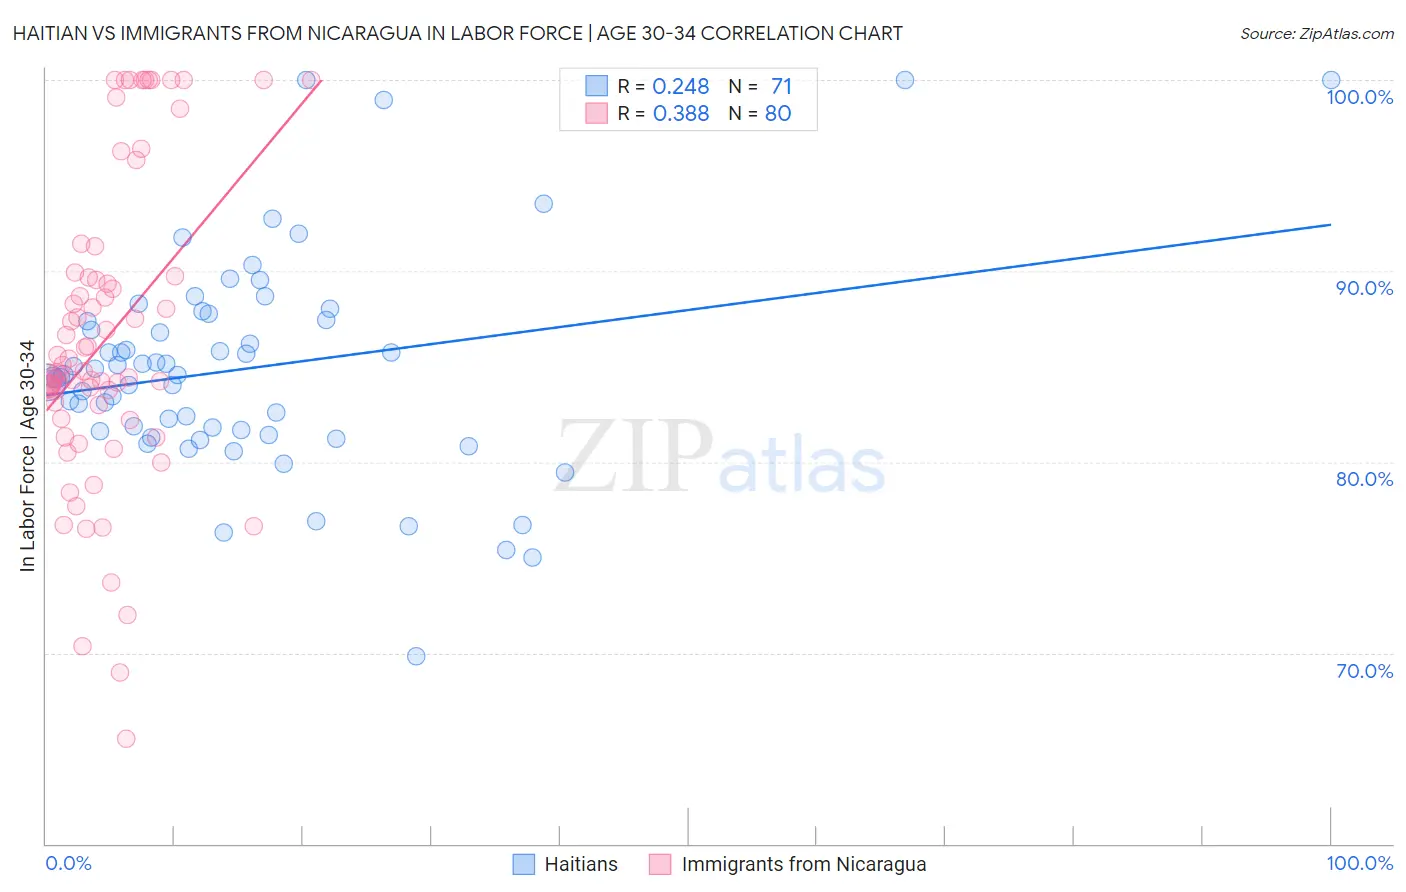
Haitian vs Immigrants from Nicaragua In Labor Force | Age 30-34 Correlation Chart
The statistical analysis conducted on geographies consisting of 287,776,350 people shows a weak positive correlation between the proportion of Haitians and labor force participation rate among population between the ages 30 and 34 in the United States with a correlation coefficient (R) of 0.248 and weighted average of 84.1%. Similarly, the statistical analysis conducted on geographies consisting of 236,321,659 people shows a mild positive correlation between the proportion of Immigrants from Nicaragua and labor force participation rate among population between the ages 30 and 34 in the United States with a correlation coefficient (R) of 0.388 and weighted average of 83.9%, a difference of 0.20%.
In Labor Force | Age 30-34 Correlation Summary
| Measurement | Haitian | Immigrants from Nicaragua |
| Minimum | 69.8% | 65.5% |
| Maximum | 100.0% | 100.0% |
| Range | 30.2% | 34.5% |
| Mean | 84.9% | 86.5% |
| Median | 84.6% | 84.7% |
| Interquartile 25% (IQ1) | 81.6% | 82.6% |
| Interquartile 75% (IQ3) | 87.4% | 89.7% |
| Interquartile Range (IQR) | 5.8% | 7.1% |
| Standard Deviation (Sample) | 5.6% | 8.0% |
| Standard Deviation (Population) | 5.6% | 7.9% |
Demographics Similar to Haitians and Immigrants from Nicaragua by In Labor Force | Age 30-34
In terms of in labor force | age 30-34, the demographic groups most similar to Haitians are West Indian (84.1%, a difference of 0.010%), French American Indian (84.1%, a difference of 0.010%), U.S. Virgin Islander (84.1%, a difference of 0.030%), Celtic (84.1%, a difference of 0.040%), and Immigrants from Barbados (84.0%, a difference of 0.050%). Similarly, the demographic groups most similar to Immigrants from Nicaragua are Bahamian (83.9%, a difference of 0.0%), Nicaraguan (83.9%, a difference of 0.010%), Immigrants from Iraq (83.9%, a difference of 0.020%), Immigrants from Dominica (84.0%, a difference of 0.040%), and Portuguese (84.0%, a difference of 0.050%).
| Demographics | Rating | Rank | In Labor Force | Age 30-34 |
| West Indians | 1.9 /100 | #233 | Tragic 84.1% |
| Haitians | 1.8 /100 | #234 | Tragic 84.1% |
| French American Indians | 1.7 /100 | #235 | Tragic 84.1% |
| U.S. Virgin Islanders | 1.5 /100 | #236 | Tragic 84.1% |
| Celtics | 1.4 /100 | #237 | Tragic 84.1% |
| Immigrants | Barbados | 1.4 /100 | #238 | Tragic 84.0% |
| English | 1.4 /100 | #239 | Tragic 84.0% |
| Venezuelans | 1.3 /100 | #240 | Tragic 84.0% |
| Immigrants | Portugal | 1.2 /100 | #241 | Tragic 84.0% |
| Immigrants | Oceania | 1.1 /100 | #242 | Tragic 84.0% |
| Immigrants | Caribbean | 1.1 /100 | #243 | Tragic 84.0% |
| Basques | 0.9 /100 | #244 | Tragic 84.0% |
| Immigrants | Venezuela | 0.9 /100 | #245 | Tragic 84.0% |
| Central Americans | 0.9 /100 | #246 | Tragic 84.0% |
| British West Indians | 0.8 /100 | #247 | Tragic 84.0% |
| Portuguese | 0.8 /100 | #248 | Tragic 84.0% |
| Immigrants | Dominica | 0.7 /100 | #249 | Tragic 84.0% |
| Immigrants | Iraq | 0.7 /100 | #250 | Tragic 83.9% |
| Nicaraguans | 0.6 /100 | #251 | Tragic 83.9% |
| Bahamians | 0.6 /100 | #252 | Tragic 83.9% |
| Immigrants | Nicaragua | 0.6 /100 | #253 | Tragic 83.9% |