Immigrants from Central America vs Immigrants from Dominica In Labor Force | Age 35-44
COMPARE
Immigrants from Central America
Immigrants from Dominica
In Labor Force | Age 35-44
In Labor Force | Age 35-44 Comparison
Immigrants from Central America
Immigrants from Dominica
82.0%
IN LABOR FORCE | AGE 35-44
0.0/ 100
METRIC RATING
308th/ 347
METRIC RANK
83.5%
IN LABOR FORCE | AGE 35-44
0.2/ 100
METRIC RATING
261st/ 347
METRIC RANK
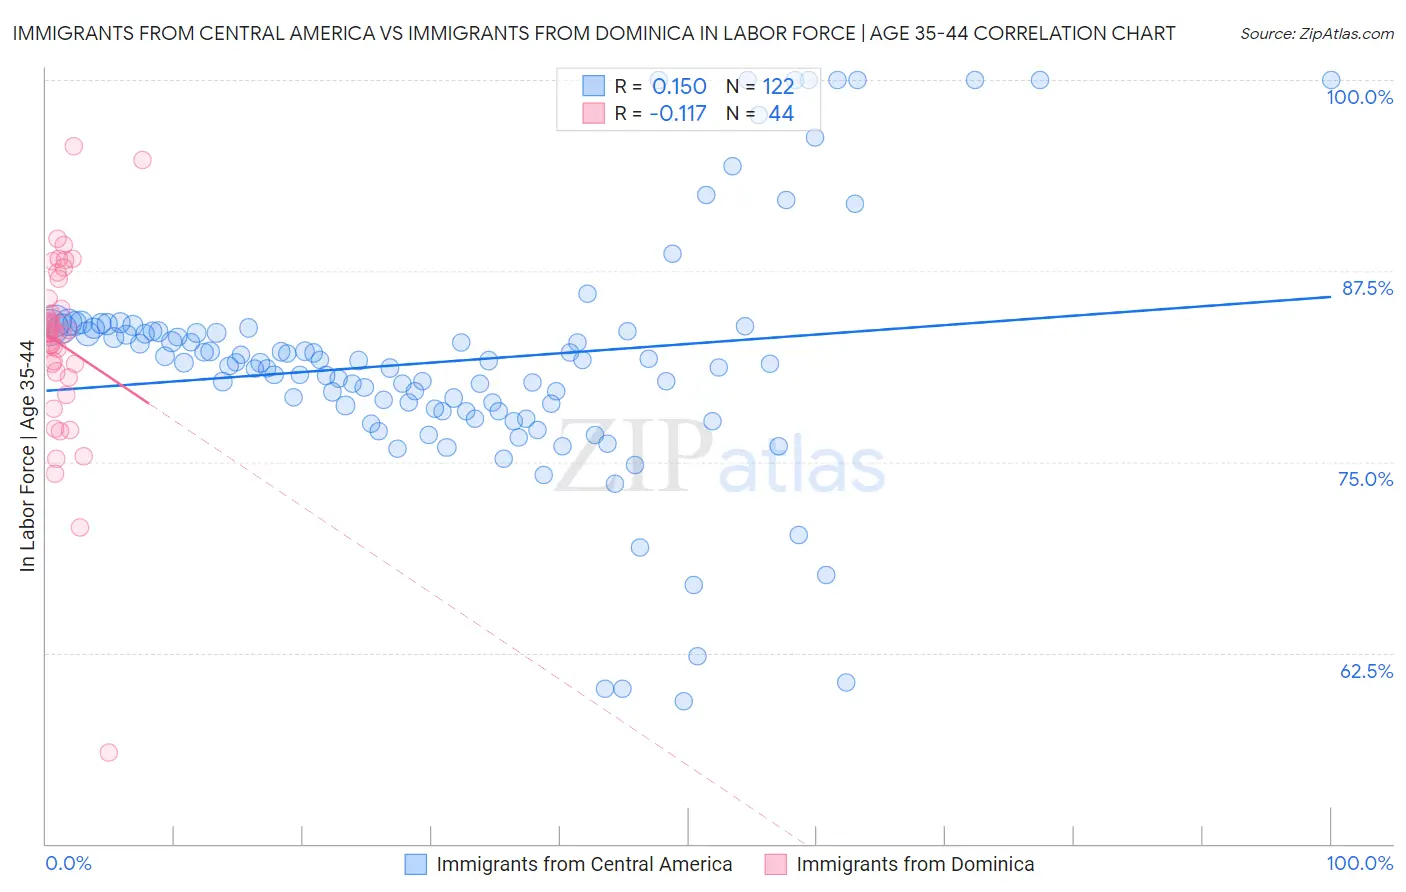
Immigrants from Central America vs Immigrants from Dominica In Labor Force | Age 35-44 Correlation Chart
The statistical analysis conducted on geographies consisting of 536,091,768 people shows a poor positive correlation between the proportion of Immigrants from Central America and labor force participation rate among population between the ages 35 and 44 in the United States with a correlation coefficient (R) of 0.150 and weighted average of 82.0%. Similarly, the statistical analysis conducted on geographies consisting of 83,785,416 people shows a poor negative correlation between the proportion of Immigrants from Dominica and labor force participation rate among population between the ages 35 and 44 in the United States with a correlation coefficient (R) of -0.117 and weighted average of 83.5%, a difference of 1.9%.
In Labor Force | Age 35-44 Correlation Summary
| Measurement | Immigrants from Central America | Immigrants from Dominica |
| Minimum | 59.3% | 56.0% |
| Maximum | 100.0% | 95.7% |
| Range | 40.7% | 39.7% |
| Mean | 81.6% | 82.7% |
| Median | 81.5% | 83.4% |
| Interquartile 25% (IQ1) | 78.3% | 80.7% |
| Interquartile 75% (IQ3) | 83.5% | 86.4% |
| Interquartile Range (IQR) | 5.2% | 5.7% |
| Standard Deviation (Sample) | 8.0% | 6.5% |
| Standard Deviation (Population) | 8.0% | 6.4% |
Similar Demographics by In Labor Force | Age 35-44
Demographics Similar to Immigrants from Central America by In Labor Force | Age 35-44
In terms of in labor force | age 35-44, the demographic groups most similar to Immigrants from Central America are Cree (82.0%, a difference of 0.0%), Blackfeet (81.9%, a difference of 0.13%), Hispanic or Latino (82.1%, a difference of 0.15%), Black/African American (82.2%, a difference of 0.25%), and Shoshone (82.2%, a difference of 0.27%).
| Demographics | Rating | Rank | In Labor Force | Age 35-44 |
| Spanish American Indians | 0.0 /100 | #301 | Tragic 82.5% |
| Americans | 0.0 /100 | #302 | Tragic 82.4% |
| Nepalese | 0.0 /100 | #303 | Tragic 82.4% |
| Marshallese | 0.0 /100 | #304 | Tragic 82.4% |
| Shoshone | 0.0 /100 | #305 | Tragic 82.2% |
| Blacks/African Americans | 0.0 /100 | #306 | Tragic 82.2% |
| Hispanics or Latinos | 0.0 /100 | #307 | Tragic 82.1% |
| Immigrants | Central America | 0.0 /100 | #308 | Tragic 82.0% |
| Cree | 0.0 /100 | #309 | Tragic 82.0% |
| Blackfeet | 0.0 /100 | #310 | Tragic 81.9% |
| Colville | 0.0 /100 | #311 | Tragic 81.7% |
| Alaska Natives | 0.0 /100 | #312 | Tragic 81.6% |
| Mexicans | 0.0 /100 | #313 | Tragic 81.6% |
| Cajuns | 0.0 /100 | #314 | Tragic 81.5% |
| Immigrants | Mexico | 0.0 /100 | #315 | Tragic 81.5% |
Demographics Similar to Immigrants from Dominica by In Labor Force | Age 35-44
In terms of in labor force | age 35-44, the demographic groups most similar to Immigrants from Dominica are Vietnamese (83.5%, a difference of 0.0%), Immigrants from El Salvador (83.5%, a difference of 0.010%), Immigrants from Congo (83.5%, a difference of 0.010%), Iroquois (83.5%, a difference of 0.030%), and Tsimshian (83.5%, a difference of 0.040%).
| Demographics | Rating | Rank | In Labor Force | Age 35-44 |
| Tongans | 0.4 /100 | #254 | Tragic 83.6% |
| Immigrants | Azores | 0.3 /100 | #255 | Tragic 83.6% |
| Japanese | 0.3 /100 | #256 | Tragic 83.6% |
| Basques | 0.3 /100 | #257 | Tragic 83.6% |
| Tsimshian | 0.2 /100 | #258 | Tragic 83.5% |
| Immigrants | El Salvador | 0.2 /100 | #259 | Tragic 83.5% |
| Vietnamese | 0.2 /100 | #260 | Tragic 83.5% |
| Immigrants | Dominica | 0.2 /100 | #261 | Tragic 83.5% |
| Immigrants | Congo | 0.2 /100 | #262 | Tragic 83.5% |
| Iroquois | 0.2 /100 | #263 | Tragic 83.5% |
| Scotch-Irish | 0.1 /100 | #264 | Tragic 83.5% |
| Central Americans | 0.1 /100 | #265 | Tragic 83.5% |
| Spaniards | 0.1 /100 | #266 | Tragic 83.4% |
| Guamanians/Chamorros | 0.1 /100 | #267 | Tragic 83.4% |
| Hondurans | 0.1 /100 | #268 | Tragic 83.4% |