Sri Lankan vs Liberian In Labor Force | Age 20-24
COMPARE
Sri Lankan
Liberian
In Labor Force | Age 20-24
In Labor Force | Age 20-24 Comparison
Sri Lankans
Liberians
74.9%
IN LABOR FORCE | AGE 20-24
34.9/ 100
METRIC RATING
185th/ 347
METRIC RANK
78.0%
IN LABOR FORCE | AGE 20-24
100.0/ 100
METRIC RATING
24th/ 347
METRIC RANK
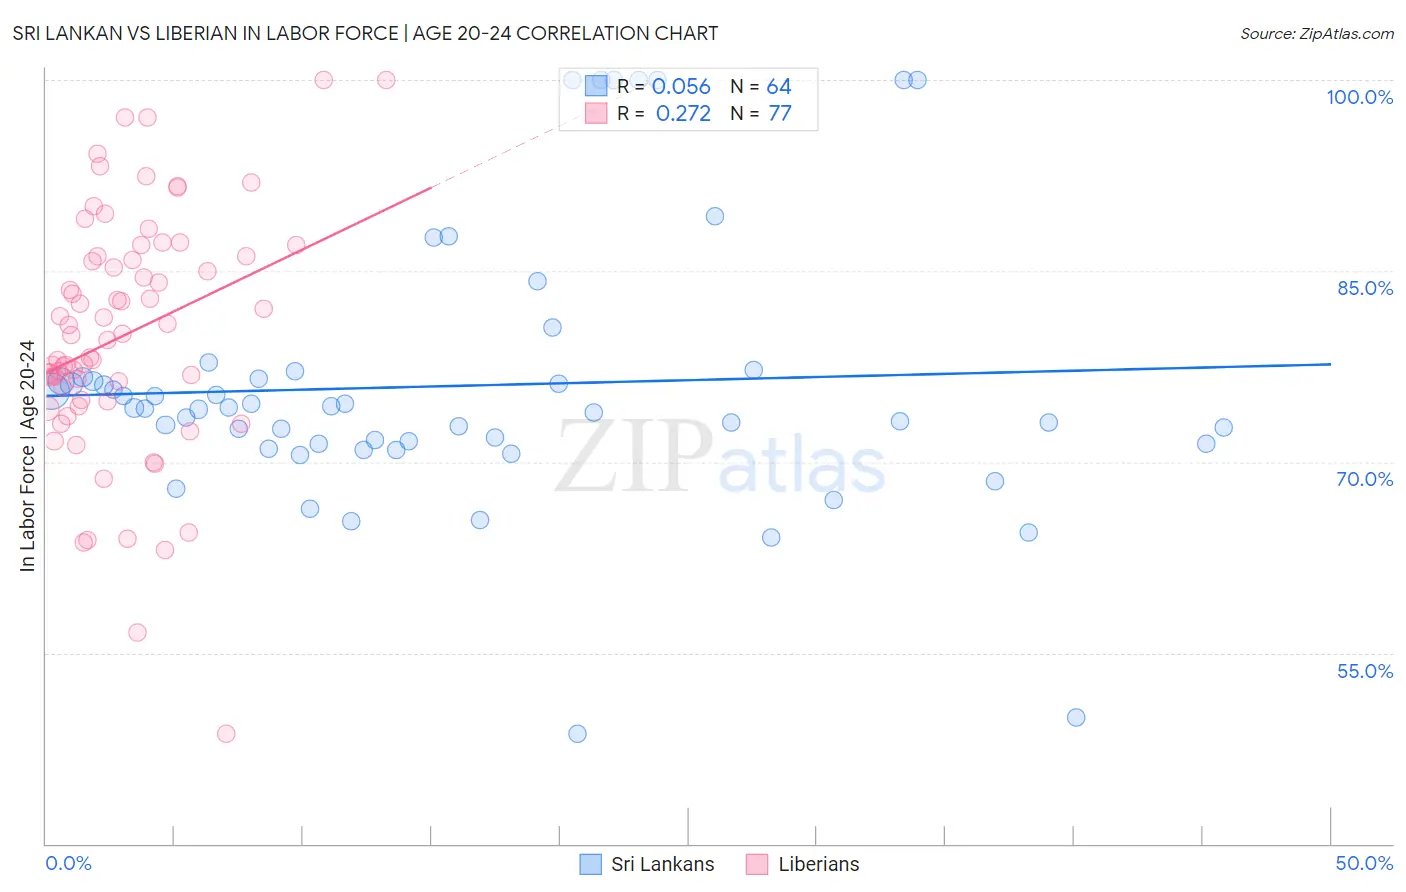
Sri Lankan vs Liberian In Labor Force | Age 20-24 Correlation Chart
The statistical analysis conducted on geographies consisting of 440,468,605 people shows a slight positive correlation between the proportion of Sri Lankans and labor force participation rate among population between the ages 20 and 24 in the United States with a correlation coefficient (R) of 0.056 and weighted average of 74.9%. Similarly, the statistical analysis conducted on geographies consisting of 118,080,661 people shows a weak positive correlation between the proportion of Liberians and labor force participation rate among population between the ages 20 and 24 in the United States with a correlation coefficient (R) of 0.272 and weighted average of 78.0%, a difference of 4.1%.
In Labor Force | Age 20-24 Correlation Summary
| Measurement | Sri Lankan | Liberian |
| Minimum | 48.6% | 48.6% |
| Maximum | 100.0% | 100.0% |
| Range | 51.4% | 51.4% |
| Mean | 76.0% | 80.0% |
| Median | 74.2% | 80.0% |
| Interquartile 25% (IQ1) | 71.4% | 74.8% |
| Interquartile 75% (IQ3) | 76.6% | 86.2% |
| Interquartile Range (IQR) | 5.2% | 11.4% |
| Standard Deviation (Sample) | 10.7% | 9.6% |
| Standard Deviation (Population) | 10.6% | 9.5% |
Similar Demographics by In Labor Force | Age 20-24
Demographics Similar to Sri Lankans by In Labor Force | Age 20-24
In terms of in labor force | age 20-24, the demographic groups most similar to Sri Lankans are Immigrants from Hungary (74.9%, a difference of 0.0%), Immigrants from Eastern Europe (74.9%, a difference of 0.020%), Immigrants from Honduras (74.9%, a difference of 0.020%), Immigrants from South Africa (74.9%, a difference of 0.030%), and Immigrants from Costa Rica (74.9%, a difference of 0.030%).
| Demographics | Rating | Rank | In Labor Force | Age 20-24 |
| Immigrants | Central America | 45.0 /100 | #178 | Average 75.0% |
| Immigrants | Latvia | 44.1 /100 | #179 | Average 75.0% |
| Immigrants | Czechoslovakia | 44.0 /100 | #180 | Average 75.0% |
| Africans | 42.5 /100 | #181 | Average 75.0% |
| Immigrants | South Africa | 36.9 /100 | #182 | Fair 74.9% |
| Immigrants | Costa Rica | 36.7 /100 | #183 | Fair 74.9% |
| Immigrants | Hungary | 35.0 /100 | #184 | Fair 74.9% |
| Sri Lankans | 34.9 /100 | #185 | Fair 74.9% |
| Immigrants | Eastern Europe | 33.8 /100 | #186 | Fair 74.9% |
| Immigrants | Honduras | 33.5 /100 | #187 | Fair 74.9% |
| Hondurans | 32.7 /100 | #188 | Fair 74.8% |
| Immigrants | Northern Europe | 32.6 /100 | #189 | Fair 74.8% |
| Russians | 32.2 /100 | #190 | Fair 74.8% |
| Senegalese | 28.1 /100 | #191 | Fair 74.8% |
| Immigrants | Europe | 27.5 /100 | #192 | Fair 74.8% |
Demographics Similar to Liberians by In Labor Force | Age 20-24
In terms of in labor force | age 20-24, the demographic groups most similar to Liberians are Yugoslavian (78.0%, a difference of 0.0%), Pennsylvania German (78.0%, a difference of 0.010%), Tlingit-Haida (77.9%, a difference of 0.040%), Tongan (77.9%, a difference of 0.060%), and Puget Sound Salish (78.0%, a difference of 0.070%).
| Demographics | Rating | Rank | In Labor Force | Age 20-24 |
| Cape Verdeans | 100.0 /100 | #17 | Exceptional 78.3% |
| Immigrants | Bosnia and Herzegovina | 100.0 /100 | #18 | Exceptional 78.1% |
| Bangladeshis | 100.0 /100 | #19 | Exceptional 78.1% |
| French Canadians | 100.0 /100 | #20 | Exceptional 78.1% |
| Puget Sound Salish | 100.0 /100 | #21 | Exceptional 78.0% |
| Pennsylvania Germans | 100.0 /100 | #22 | Exceptional 78.0% |
| Yugoslavians | 100.0 /100 | #23 | Exceptional 78.0% |
| Liberians | 100.0 /100 | #24 | Exceptional 78.0% |
| Tlingit-Haida | 100.0 /100 | #25 | Exceptional 77.9% |
| Tongans | 100.0 /100 | #26 | Exceptional 77.9% |
| Immigrants | Micronesia | 100.0 /100 | #27 | Exceptional 77.8% |
| Belgians | 100.0 /100 | #28 | Exceptional 77.8% |
| Slovaks | 100.0 /100 | #29 | Exceptional 77.7% |
| Swiss | 100.0 /100 | #30 | Exceptional 77.7% |
| Poles | 100.0 /100 | #31 | Exceptional 77.6% |