Immigrants from Asia vs Jamaican In Labor Force | Age 16-19
COMPARE
Immigrants from Asia
Jamaican
In Labor Force | Age 16-19
In Labor Force | Age 16-19 Comparison
Immigrants from Asia
Jamaicans
34.1%
IN LABOR FORCE | AGE 16-19
0.5/ 100
METRIC RATING
268th/ 347
METRIC RANK
33.2%
IN LABOR FORCE | AGE 16-19
0.1/ 100
METRIC RATING
296th/ 347
METRIC RANK
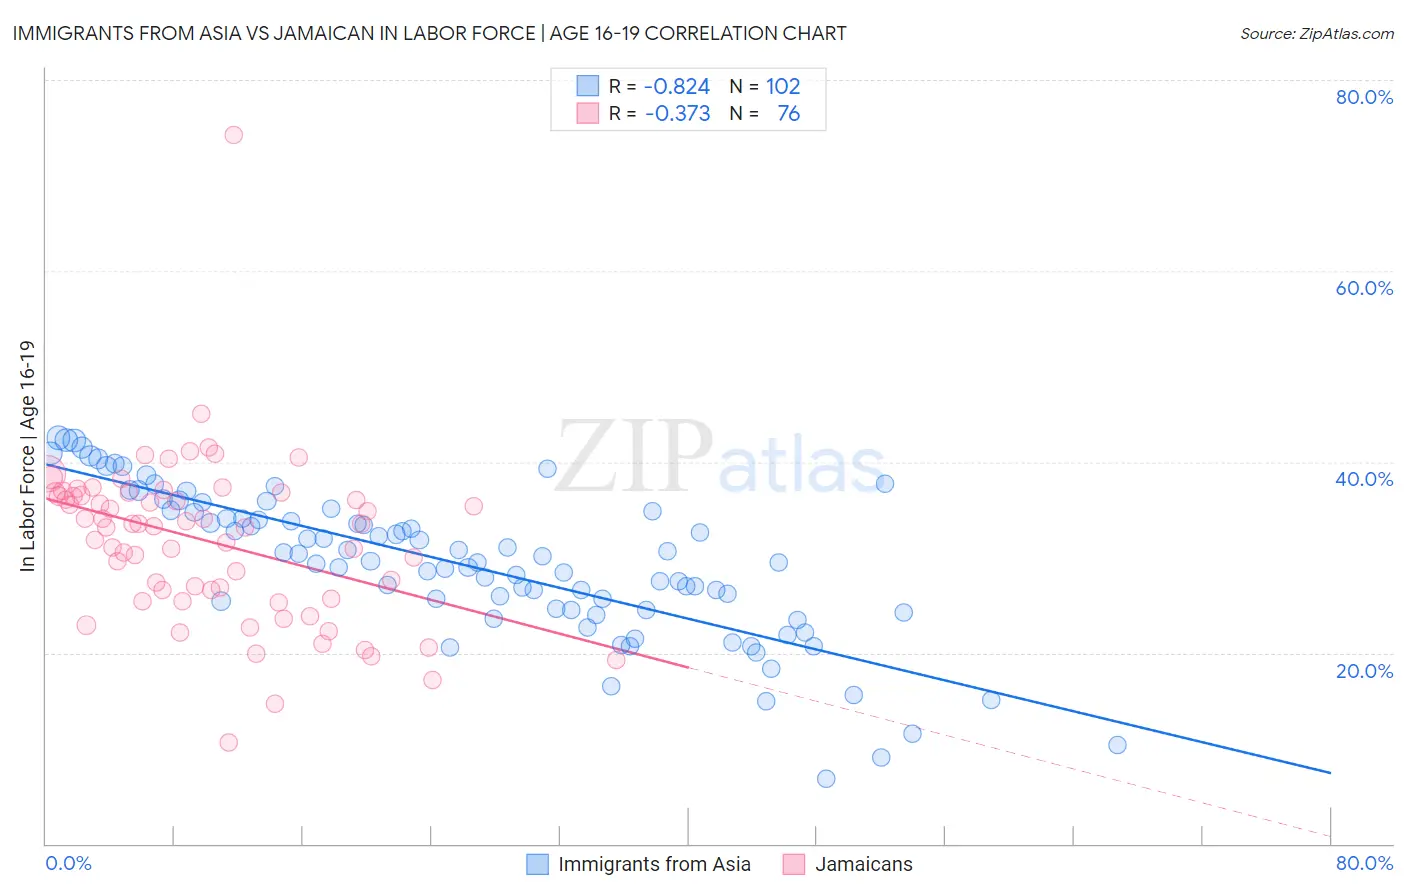
Immigrants from Asia vs Jamaican In Labor Force | Age 16-19 Correlation Chart
The statistical analysis conducted on geographies consisting of 546,796,983 people shows a very strong negative correlation between the proportion of Immigrants from Asia and labor force participation rate among population between the ages 16 and 19 in the United States with a correlation coefficient (R) of -0.824 and weighted average of 34.1%. Similarly, the statistical analysis conducted on geographies consisting of 367,624,466 people shows a mild negative correlation between the proportion of Jamaicans and labor force participation rate among population between the ages 16 and 19 in the United States with a correlation coefficient (R) of -0.373 and weighted average of 33.2%, a difference of 2.7%.
In Labor Force | Age 16-19 Correlation Summary
| Measurement | Immigrants from Asia | Jamaican |
| Minimum | 6.8% | 10.6% |
| Maximum | 42.5% | 74.2% |
| Range | 35.7% | 63.6% |
| Mean | 29.2% | 31.7% |
| Median | 29.5% | 33.4% |
| Interquartile 25% (IQ1) | 24.5% | 26.1% |
| Interquartile 75% (IQ3) | 34.7% | 36.6% |
| Interquartile Range (IQR) | 10.2% | 10.5% |
| Standard Deviation (Sample) | 7.7% | 8.7% |
| Standard Deviation (Population) | 7.7% | 8.6% |
Similar Demographics by In Labor Force | Age 16-19
Demographics Similar to Immigrants from Asia by In Labor Force | Age 16-19
In terms of in labor force | age 16-19, the demographic groups most similar to Immigrants from Asia are Pima (34.1%, a difference of 0.080%), Immigrants from Peru (34.2%, a difference of 0.12%), Immigrants from Russia (34.1%, a difference of 0.13%), Central American Indian (34.1%, a difference of 0.13%), and Asian (34.1%, a difference of 0.16%).
| Demographics | Rating | Rank | In Labor Force | Age 16-19 |
| Salvadorans | 1.1 /100 | #261 | Tragic 34.5% |
| Hispanics or Latinos | 1.1 /100 | #262 | Tragic 34.5% |
| Burmese | 1.1 /100 | #263 | Tragic 34.5% |
| Immigrants | Uruguay | 0.9 /100 | #264 | Tragic 34.4% |
| Immigrants | El Salvador | 0.7 /100 | #265 | Tragic 34.3% |
| Immigrants | Malaysia | 0.7 /100 | #266 | Tragic 34.3% |
| Immigrants | Peru | 0.5 /100 | #267 | Tragic 34.2% |
| Immigrants | Asia | 0.5 /100 | #268 | Tragic 34.1% |
| Pima | 0.5 /100 | #269 | Tragic 34.1% |
| Immigrants | Russia | 0.4 /100 | #270 | Tragic 34.1% |
| Central American Indians | 0.4 /100 | #271 | Tragic 34.1% |
| Asians | 0.4 /100 | #272 | Tragic 34.1% |
| Immigrants | Panama | 0.4 /100 | #273 | Tragic 34.0% |
| Venezuelans | 0.3 /100 | #274 | Tragic 34.0% |
| Immigrants | Fiji | 0.3 /100 | #275 | Tragic 33.9% |
Demographics Similar to Jamaicans by In Labor Force | Age 16-19
In terms of in labor force | age 16-19, the demographic groups most similar to Jamaicans are Immigrants from Haiti (33.2%, a difference of 0.090%), Yup'ik (33.3%, a difference of 0.13%), Argentinean (33.3%, a difference of 0.23%), Immigrants from South America (33.3%, a difference of 0.25%), and Haitian (33.4%, a difference of 0.57%).
| Demographics | Rating | Rank | In Labor Force | Age 16-19 |
| Immigrants | Singapore | 0.1 /100 | #289 | Tragic 33.5% |
| Immigrants | Colombia | 0.1 /100 | #290 | Tragic 33.5% |
| Immigrants | Belarus | 0.1 /100 | #291 | Tragic 33.4% |
| Haitians | 0.1 /100 | #292 | Tragic 33.4% |
| Immigrants | South America | 0.1 /100 | #293 | Tragic 33.3% |
| Argentineans | 0.1 /100 | #294 | Tragic 33.3% |
| Yup'ik | 0.1 /100 | #295 | Tragic 33.3% |
| Jamaicans | 0.1 /100 | #296 | Tragic 33.2% |
| Immigrants | Haiti | 0.1 /100 | #297 | Tragic 33.2% |
| Iranians | 0.0 /100 | #298 | Tragic 33.0% |
| Armenians | 0.0 /100 | #299 | Tragic 32.9% |
| Immigrants | Argentina | 0.0 /100 | #300 | Tragic 32.9% |
| Okinawans | 0.0 /100 | #301 | Tragic 32.8% |
| Belizeans | 0.0 /100 | #302 | Tragic 32.8% |
| Immigrants | Dominica | 0.0 /100 | #303 | Tragic 32.5% |