Russian vs Immigrants from Northern Europe In Labor Force | Age 45-54
COMPARE
Russian
Immigrants from Northern Europe
In Labor Force | Age 45-54
In Labor Force | Age 45-54 Comparison
Russians
Immigrants from Northern Europe
83.4%
IN LABOR FORCE | AGE 45-54
96.8/ 100
METRIC RATING
76th/ 347
METRIC RANK
83.1%
IN LABOR FORCE | AGE 45-54
85.1/ 100
METRIC RATING
129th/ 347
METRIC RANK
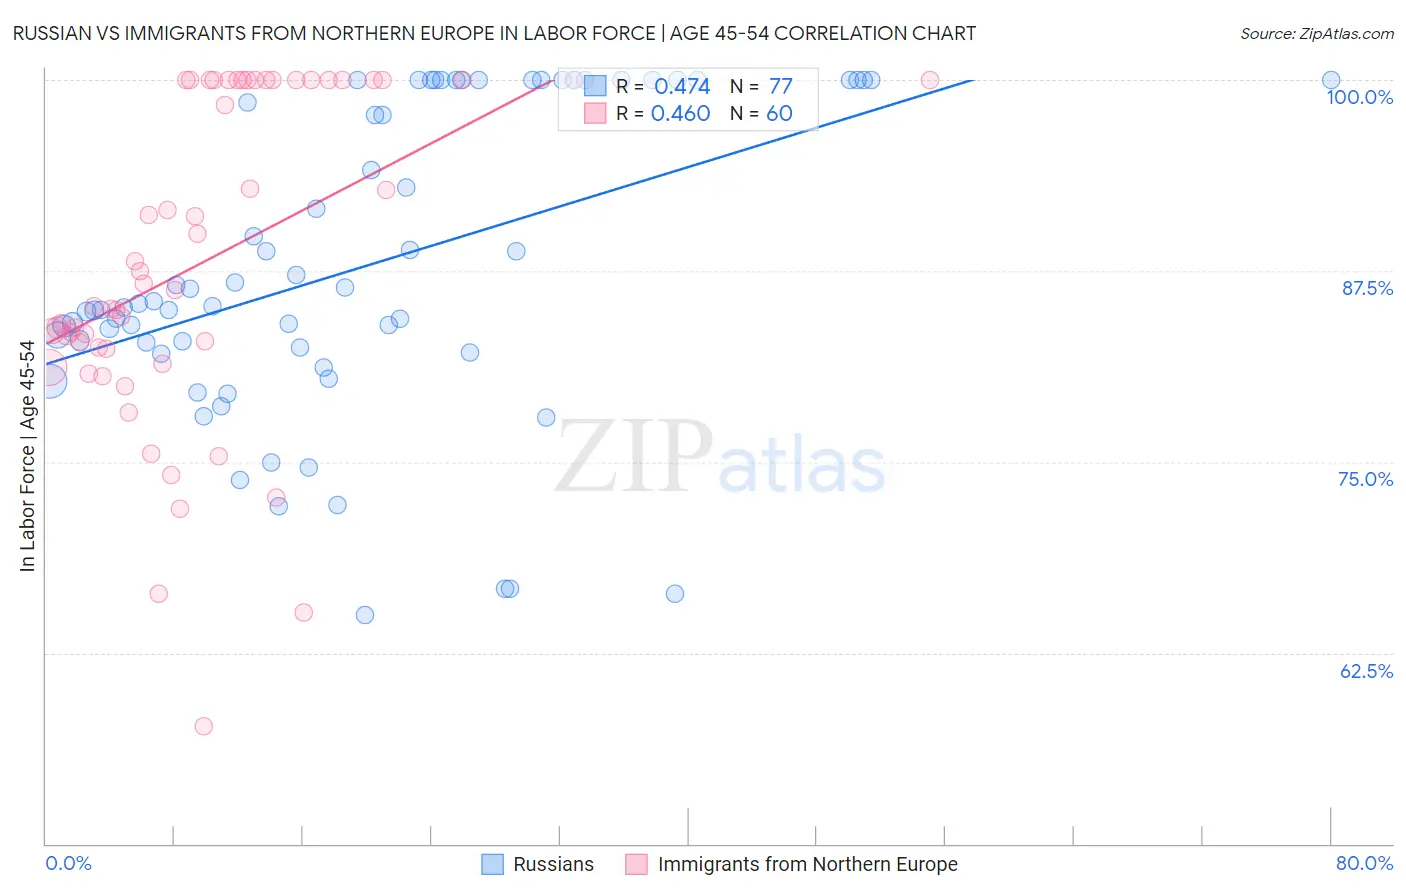
Russian vs Immigrants from Northern Europe In Labor Force | Age 45-54 Correlation Chart
The statistical analysis conducted on geographies consisting of 511,675,657 people shows a moderate positive correlation between the proportion of Russians and labor force participation rate among population between the ages 45 and 54 in the United States with a correlation coefficient (R) of 0.474 and weighted average of 83.4%. Similarly, the statistical analysis conducted on geographies consisting of 476,905,263 people shows a moderate positive correlation between the proportion of Immigrants from Northern Europe and labor force participation rate among population between the ages 45 and 54 in the United States with a correlation coefficient (R) of 0.460 and weighted average of 83.1%, a difference of 0.37%.
In Labor Force | Age 45-54 Correlation Summary
| Measurement | Russian | Immigrants from Northern Europe |
| Minimum | 65.0% | 57.7% |
| Maximum | 100.0% | 100.0% |
| Range | 35.0% | 42.3% |
| Mean | 87.8% | 88.2% |
| Median | 85.3% | 86.5% |
| Interquartile 25% (IQ1) | 82.3% | 82.5% |
| Interquartile 75% (IQ3) | 100.0% | 100.0% |
| Interquartile Range (IQR) | 17.7% | 17.5% |
| Standard Deviation (Sample) | 9.9% | 10.6% |
| Standard Deviation (Population) | 9.9% | 10.5% |
Similar Demographics by In Labor Force | Age 45-54
Demographics Similar to Russians by In Labor Force | Age 45-54
In terms of in labor force | age 45-54, the demographic groups most similar to Russians are Immigrants from Somalia (83.4%, a difference of 0.0%), Estonian (83.4%, a difference of 0.0%), Cuban (83.4%, a difference of 0.010%), Immigrants from Egypt (83.4%, a difference of 0.010%), and Serbian (83.4%, a difference of 0.020%).
| Demographics | Rating | Rank | In Labor Force | Age 45-54 |
| Taiwanese | 97.5 /100 | #69 | Exceptional 83.4% |
| Immigrants | Latvia | 97.4 /100 | #70 | Exceptional 83.4% |
| Colombians | 97.3 /100 | #71 | Exceptional 83.4% |
| Serbians | 97.2 /100 | #72 | Exceptional 83.4% |
| Immigrants | Czechoslovakia | 97.1 /100 | #73 | Exceptional 83.4% |
| Immigrants | Somalia | 96.9 /100 | #74 | Exceptional 83.4% |
| Estonians | 96.9 /100 | #75 | Exceptional 83.4% |
| Russians | 96.8 /100 | #76 | Exceptional 83.4% |
| Cubans | 96.7 /100 | #77 | Exceptional 83.4% |
| Immigrants | Egypt | 96.6 /100 | #78 | Exceptional 83.4% |
| Belgians | 96.5 /100 | #79 | Exceptional 83.4% |
| Immigrants | Croatia | 96.5 /100 | #80 | Exceptional 83.4% |
| Jordanians | 96.4 /100 | #81 | Exceptional 83.4% |
| Immigrants | Eastern Asia | 96.3 /100 | #82 | Exceptional 83.4% |
| Immigrants | Zimbabwe | 96.3 /100 | #83 | Exceptional 83.4% |
Demographics Similar to Immigrants from Northern Europe by In Labor Force | Age 45-54
In terms of in labor force | age 45-54, the demographic groups most similar to Immigrants from Northern Europe are Immigrants from Jordan (83.1%, a difference of 0.0%), German (83.1%, a difference of 0.0%), Immigrants from Israel (83.1%, a difference of 0.010%), Immigrants from Belgium (83.1%, a difference of 0.020%), and Finnish (83.1%, a difference of 0.030%).
| Demographics | Rating | Rank | In Labor Force | Age 45-54 |
| Immigrants | Vietnam | 88.9 /100 | #122 | Excellent 83.1% |
| Tongans | 88.2 /100 | #123 | Excellent 83.1% |
| Bermudans | 88.0 /100 | #124 | Excellent 83.1% |
| Immigrants | Iran | 87.2 /100 | #125 | Excellent 83.1% |
| Immigrants | Belgium | 86.4 /100 | #126 | Excellent 83.1% |
| Immigrants | Jordan | 85.2 /100 | #127 | Excellent 83.1% |
| Germans | 85.1 /100 | #128 | Excellent 83.1% |
| Immigrants | Northern Europe | 85.1 /100 | #129 | Excellent 83.1% |
| Immigrants | Israel | 84.7 /100 | #130 | Excellent 83.1% |
| Finns | 83.3 /100 | #131 | Excellent 83.1% |
| Immigrants | Ukraine | 82.9 /100 | #132 | Excellent 83.0% |
| Liberians | 82.7 /100 | #133 | Excellent 83.0% |
| Sudanese | 82.0 /100 | #134 | Excellent 83.0% |
| Austrians | 81.3 /100 | #135 | Excellent 83.0% |
| Immigrants | Kazakhstan | 81.0 /100 | #136 | Excellent 83.0% |