Immigrants from Iran vs Ugandan In Labor Force | Age 45-54
COMPARE
Immigrants from Iran
Ugandan
In Labor Force | Age 45-54
In Labor Force | Age 45-54 Comparison
Immigrants from Iran
Ugandans
83.1%
IN LABOR FORCE | AGE 45-54
87.2/ 100
METRIC RATING
125th/ 347
METRIC RANK
83.7%
IN LABOR FORCE | AGE 45-54
99.5/ 100
METRIC RATING
36th/ 347
METRIC RANK
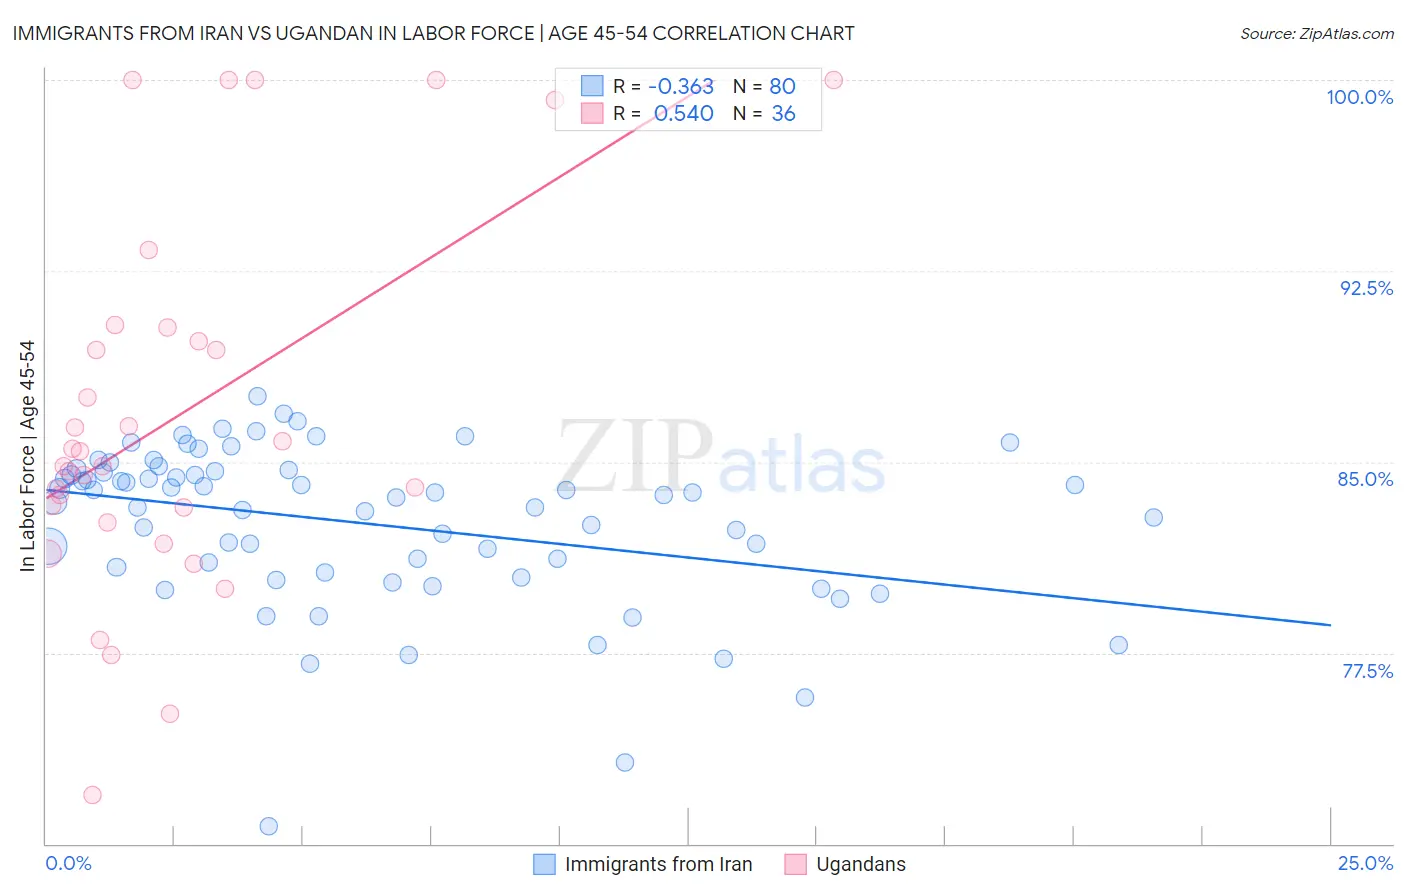
Immigrants from Iran vs Ugandan In Labor Force | Age 45-54 Correlation Chart
The statistical analysis conducted on geographies consisting of 279,820,433 people shows a mild negative correlation between the proportion of Immigrants from Iran and labor force participation rate among population between the ages 45 and 54 in the United States with a correlation coefficient (R) of -0.363 and weighted average of 83.1%. Similarly, the statistical analysis conducted on geographies consisting of 93,996,465 people shows a substantial positive correlation between the proportion of Ugandans and labor force participation rate among population between the ages 45 and 54 in the United States with a correlation coefficient (R) of 0.540 and weighted average of 83.7%, a difference of 0.73%.
In Labor Force | Age 45-54 Correlation Summary
| Measurement | Immigrants from Iran | Ugandan |
| Minimum | 70.7% | 71.9% |
| Maximum | 87.6% | 100.0% |
| Range | 16.9% | 28.1% |
| Mean | 82.6% | 86.8% |
| Median | 83.7% | 85.1% |
| Interquartile 25% (IQ1) | 80.8% | 82.9% |
| Interquartile 75% (IQ3) | 84.6% | 90.0% |
| Interquartile Range (IQR) | 3.9% | 7.1% |
| Standard Deviation (Sample) | 3.1% | 7.3% |
| Standard Deviation (Population) | 3.1% | 7.2% |
Similar Demographics by In Labor Force | Age 45-54
Demographics Similar to Immigrants from Iran by In Labor Force | Age 45-54
In terms of in labor force | age 45-54, the demographic groups most similar to Immigrants from Iran are Tongan (83.1%, a difference of 0.020%), Bermudan (83.1%, a difference of 0.020%), Immigrants from Belgium (83.1%, a difference of 0.020%), Immigrants from Vietnam (83.1%, a difference of 0.030%), and Uruguayan (83.1%, a difference of 0.040%).
| Demographics | Rating | Rank | In Labor Force | Age 45-54 |
| Immigrants | Europe | 90.7 /100 | #118 | Exceptional 83.2% |
| Immigrants | Uruguay | 90.2 /100 | #119 | Exceptional 83.2% |
| Immigrants | Russia | 90.1 /100 | #120 | Exceptional 83.2% |
| Uruguayans | 89.4 /100 | #121 | Excellent 83.1% |
| Immigrants | Vietnam | 88.9 /100 | #122 | Excellent 83.1% |
| Tongans | 88.2 /100 | #123 | Excellent 83.1% |
| Bermudans | 88.0 /100 | #124 | Excellent 83.1% |
| Immigrants | Iran | 87.2 /100 | #125 | Excellent 83.1% |
| Immigrants | Belgium | 86.4 /100 | #126 | Excellent 83.1% |
| Immigrants | Jordan | 85.2 /100 | #127 | Excellent 83.1% |
| Germans | 85.1 /100 | #128 | Excellent 83.1% |
| Immigrants | Northern Europe | 85.1 /100 | #129 | Excellent 83.1% |
| Immigrants | Israel | 84.7 /100 | #130 | Excellent 83.1% |
| Finns | 83.3 /100 | #131 | Excellent 83.1% |
| Immigrants | Ukraine | 82.9 /100 | #132 | Excellent 83.0% |
Demographics Similar to Ugandans by In Labor Force | Age 45-54
In terms of in labor force | age 45-54, the demographic groups most similar to Ugandans are Kenyan (83.7%, a difference of 0.0%), Brazilian (83.7%, a difference of 0.0%), Swedish (83.7%, a difference of 0.020%), Immigrants from Venezuela (83.7%, a difference of 0.040%), and Immigrants from Cuba (83.7%, a difference of 0.040%).
| Demographics | Rating | Rank | In Labor Force | Age 45-54 |
| Immigrants | Pakistan | 99.7 /100 | #29 | Exceptional 83.8% |
| Immigrants | Bulgaria | 99.7 /100 | #30 | Exceptional 83.8% |
| Immigrants | Eritrea | 99.7 /100 | #31 | Exceptional 83.8% |
| Turks | 99.7 /100 | #32 | Exceptional 83.8% |
| Latvians | 99.7 /100 | #33 | Exceptional 83.8% |
| Kenyans | 99.5 /100 | #34 | Exceptional 83.7% |
| Brazilians | 99.5 /100 | #35 | Exceptional 83.7% |
| Ugandans | 99.5 /100 | #36 | Exceptional 83.7% |
| Swedes | 99.4 /100 | #37 | Exceptional 83.7% |
| Immigrants | Venezuela | 99.4 /100 | #38 | Exceptional 83.7% |
| Immigrants | Cuba | 99.4 /100 | #39 | Exceptional 83.7% |
| Immigrants | Uganda | 99.4 /100 | #40 | Exceptional 83.7% |
| Immigrants | Korea | 99.3 /100 | #41 | Exceptional 83.7% |
| Immigrants | Moldova | 99.3 /100 | #42 | Exceptional 83.7% |
| Venezuelans | 99.2 /100 | #43 | Exceptional 83.6% |