Houma vs Pima In Labor Force | Age 16-19
COMPARE
Houma
Pima
In Labor Force | Age 16-19
In Labor Force | Age 16-19 Comparison
Houma
Pima
35.6%
IN LABOR FORCE | AGE 16-19
11.0/ 100
METRIC RATING
212th/ 347
METRIC RANK
34.1%
IN LABOR FORCE | AGE 16-19
0.5/ 100
METRIC RATING
269th/ 347
METRIC RANK
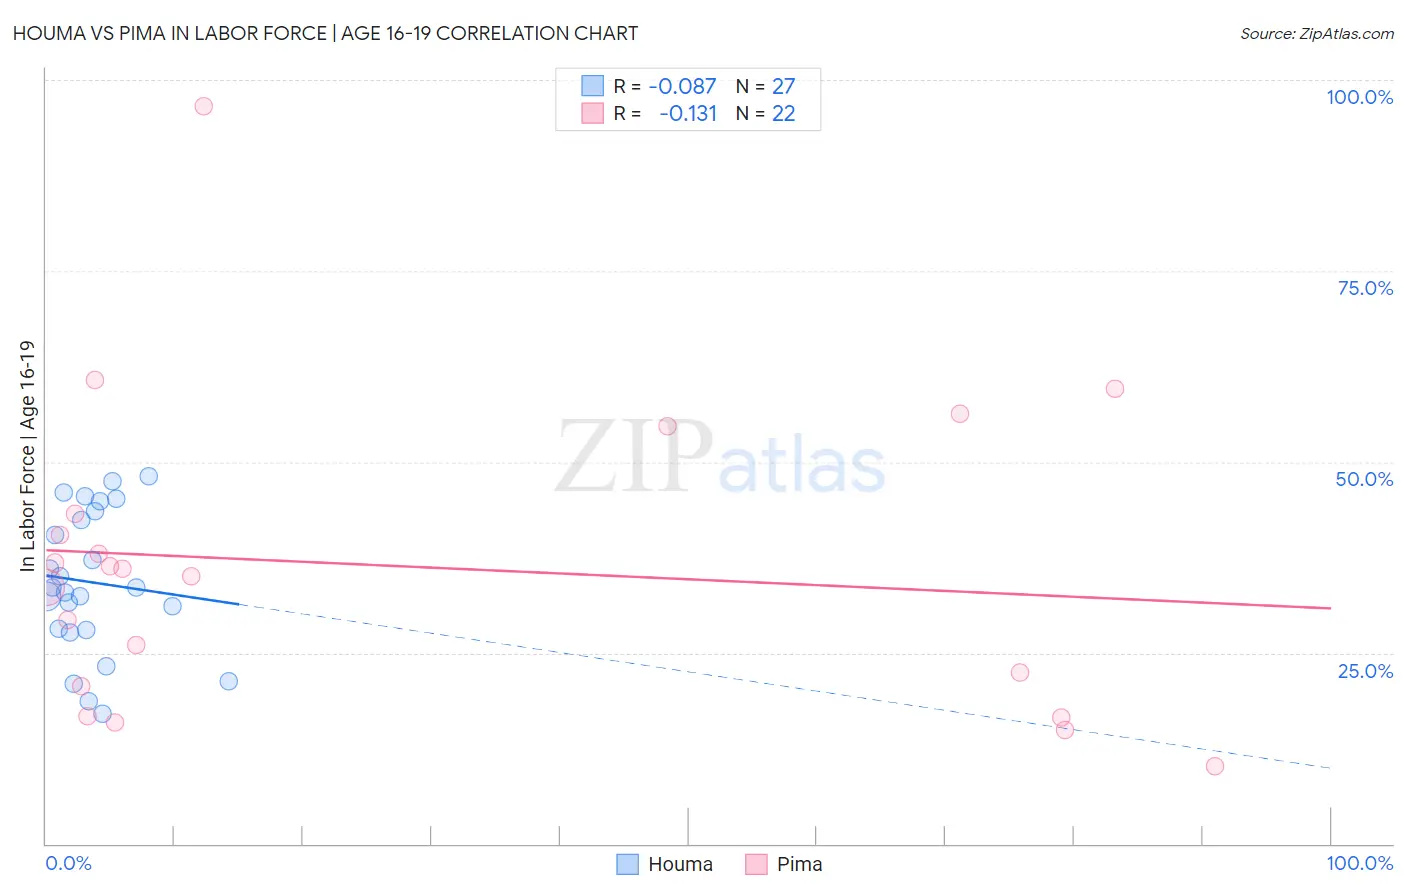
Houma vs Pima In Labor Force | Age 16-19 Correlation Chart
The statistical analysis conducted on geographies consisting of 36,777,014 people shows a slight negative correlation between the proportion of Houma and labor force participation rate among population between the ages 16 and 19 in the United States with a correlation coefficient (R) of -0.087 and weighted average of 35.6%. Similarly, the statistical analysis conducted on geographies consisting of 61,494,097 people shows a poor negative correlation between the proportion of Pima and labor force participation rate among population between the ages 16 and 19 in the United States with a correlation coefficient (R) of -0.131 and weighted average of 34.1%, a difference of 4.5%.
In Labor Force | Age 16-19 Correlation Summary
| Measurement | Houma | Pima |
| Minimum | 17.1% | 10.2% |
| Maximum | 48.1% | 96.6% |
| Range | 31.0% | 86.4% |
| Mean | 34.2% | 36.4% |
| Median | 33.5% | 35.6% |
| Interquartile 25% (IQ1) | 28.0% | 20.7% |
| Interquartile 75% (IQ3) | 43.6% | 43.3% |
| Interquartile Range (IQR) | 15.6% | 22.6% |
| Standard Deviation (Sample) | 9.2% | 20.1% |
| Standard Deviation (Population) | 9.1% | 19.7% |
Similar Demographics by In Labor Force | Age 16-19
Demographics Similar to Houma by In Labor Force | Age 16-19
In terms of in labor force | age 16-19, the demographic groups most similar to Houma are Immigrants from Bolivia (35.6%, a difference of 0.0%), Apache (35.6%, a difference of 0.010%), Immigrants from South Eastern Asia (35.6%, a difference of 0.030%), Dutch West Indian (35.6%, a difference of 0.050%), and Immigrants from Costa Rica (35.6%, a difference of 0.050%).
| Demographics | Rating | Rank | In Labor Force | Age 16-19 |
| South American Indians | 14.6 /100 | #205 | Poor 35.8% |
| Chileans | 14.6 /100 | #206 | Poor 35.8% |
| Immigrants | Eastern Europe | 14.5 /100 | #207 | Poor 35.8% |
| Koreans | 13.3 /100 | #208 | Poor 35.7% |
| Moroccans | 12.7 /100 | #209 | Poor 35.7% |
| Immigrants | Switzerland | 11.9 /100 | #210 | Poor 35.6% |
| Mexicans | 11.9 /100 | #211 | Poor 35.6% |
| Houma | 11.0 /100 | #212 | Poor 35.6% |
| Immigrants | Bolivia | 11.0 /100 | #213 | Poor 35.6% |
| Apache | 11.0 /100 | #214 | Poor 35.6% |
| Immigrants | South Eastern Asia | 10.8 /100 | #215 | Poor 35.6% |
| Dutch West Indians | 10.7 /100 | #216 | Poor 35.6% |
| Immigrants | Costa Rica | 10.7 /100 | #217 | Poor 35.6% |
| Sri Lankans | 9.8 /100 | #218 | Tragic 35.5% |
| Guatemalans | 8.6 /100 | #219 | Tragic 35.5% |
Demographics Similar to Pima by In Labor Force | Age 16-19
In terms of in labor force | age 16-19, the demographic groups most similar to Pima are Immigrants from Russia (34.1%, a difference of 0.050%), Central American Indian (34.1%, a difference of 0.050%), Asian (34.1%, a difference of 0.070%), Immigrants from Asia (34.1%, a difference of 0.080%), and Immigrants from Peru (34.2%, a difference of 0.20%).
| Demographics | Rating | Rank | In Labor Force | Age 16-19 |
| Hispanics or Latinos | 1.1 /100 | #262 | Tragic 34.5% |
| Burmese | 1.1 /100 | #263 | Tragic 34.5% |
| Immigrants | Uruguay | 0.9 /100 | #264 | Tragic 34.4% |
| Immigrants | El Salvador | 0.7 /100 | #265 | Tragic 34.3% |
| Immigrants | Malaysia | 0.7 /100 | #266 | Tragic 34.3% |
| Immigrants | Peru | 0.5 /100 | #267 | Tragic 34.2% |
| Immigrants | Asia | 0.5 /100 | #268 | Tragic 34.1% |
| Pima | 0.5 /100 | #269 | Tragic 34.1% |
| Immigrants | Russia | 0.4 /100 | #270 | Tragic 34.1% |
| Central American Indians | 0.4 /100 | #271 | Tragic 34.1% |
| Asians | 0.4 /100 | #272 | Tragic 34.1% |
| Immigrants | Panama | 0.4 /100 | #273 | Tragic 34.0% |
| Venezuelans | 0.3 /100 | #274 | Tragic 34.0% |
| Immigrants | Fiji | 0.3 /100 | #275 | Tragic 33.9% |
| Immigrants | Latin America | 0.3 /100 | #276 | Tragic 33.9% |