Iraqi vs Pima In Labor Force | Age 16-19
COMPARE
Iraqi
Pima
In Labor Force | Age 16-19
In Labor Force | Age 16-19 Comparison
Iraqis
Pima
38.6%
IN LABOR FORCE | AGE 16-19
98.9/ 100
METRIC RATING
105th/ 347
METRIC RANK
34.1%
IN LABOR FORCE | AGE 16-19
0.5/ 100
METRIC RATING
269th/ 347
METRIC RANK
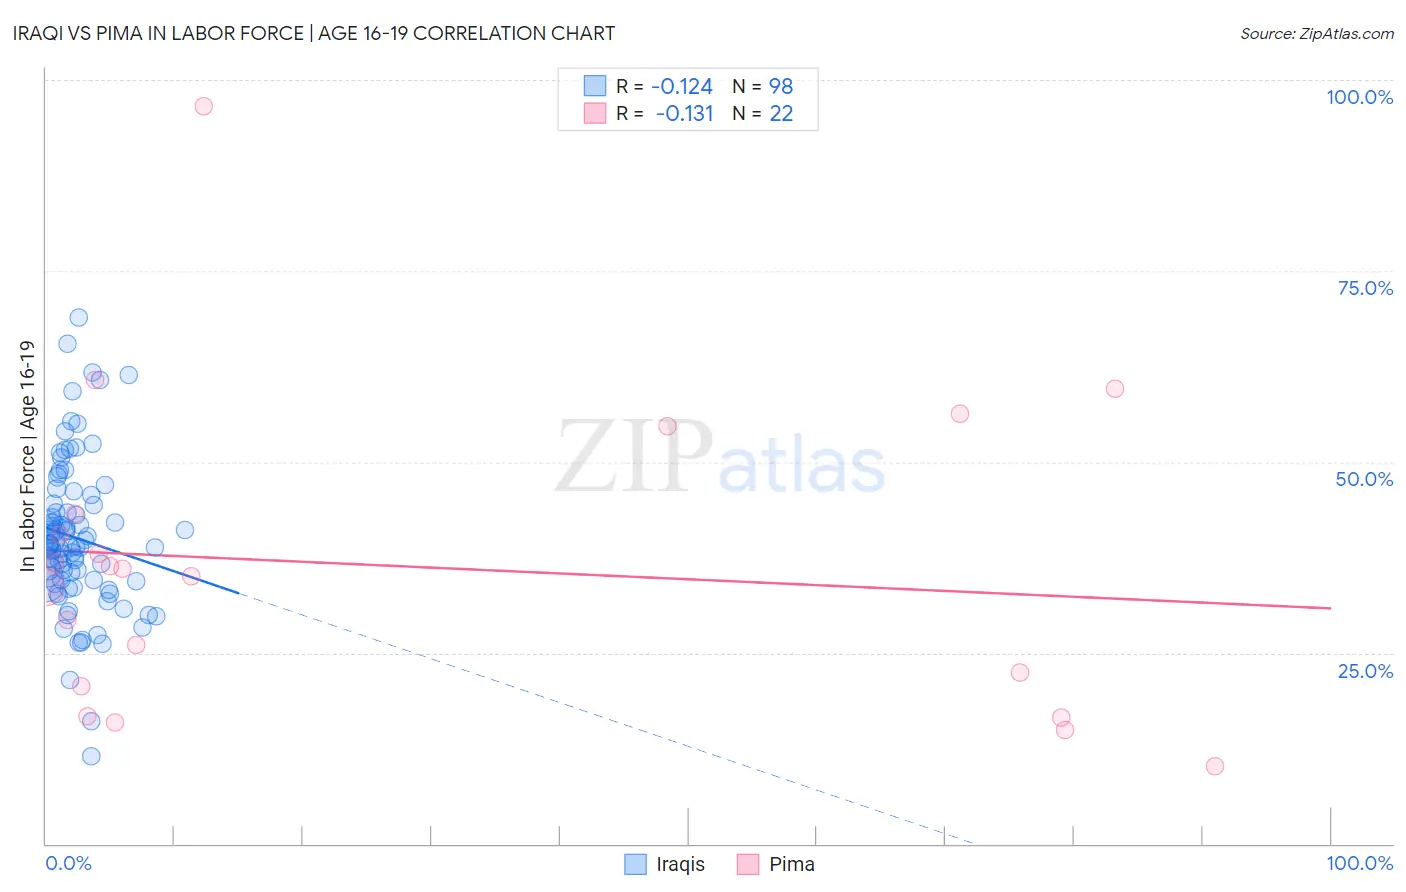
Iraqi vs Pima In Labor Force | Age 16-19 Correlation Chart
The statistical analysis conducted on geographies consisting of 170,586,304 people shows a poor negative correlation between the proportion of Iraqis and labor force participation rate among population between the ages 16 and 19 in the United States with a correlation coefficient (R) of -0.124 and weighted average of 38.6%. Similarly, the statistical analysis conducted on geographies consisting of 61,494,097 people shows a poor negative correlation between the proportion of Pima and labor force participation rate among population between the ages 16 and 19 in the United States with a correlation coefficient (R) of -0.131 and weighted average of 34.1%, a difference of 13.3%.
In Labor Force | Age 16-19 Correlation Summary
| Measurement | Iraqi | Pima |
| Minimum | 11.4% | 10.2% |
| Maximum | 68.9% | 96.6% |
| Range | 57.5% | 86.4% |
| Mean | 40.0% | 36.4% |
| Median | 39.0% | 35.6% |
| Interquartile 25% (IQ1) | 34.4% | 20.7% |
| Interquartile 75% (IQ3) | 44.3% | 43.3% |
| Interquartile Range (IQR) | 9.9% | 22.6% |
| Standard Deviation (Sample) | 9.8% | 20.1% |
| Standard Deviation (Population) | 9.8% | 19.7% |
Similar Demographics by In Labor Force | Age 16-19
Demographics Similar to Iraqis by In Labor Force | Age 16-19
In terms of in labor force | age 16-19, the demographic groups most similar to Iraqis are Delaware (38.6%, a difference of 0.020%), Chinese (38.6%, a difference of 0.050%), Immigrants from Ethiopia (38.6%, a difference of 0.15%), Lebanese (38.6%, a difference of 0.15%), and Immigrants from Eritrea (38.7%, a difference of 0.16%).
| Demographics | Rating | Rank | In Labor Force | Age 16-19 |
| Ugandans | 99.3 /100 | #98 | Exceptional 38.9% |
| Immigrants | North Macedonia | 99.3 /100 | #99 | Exceptional 38.9% |
| Immigrants | Thailand | 99.1 /100 | #100 | Exceptional 38.7% |
| Hmong | 99.1 /100 | #101 | Exceptional 38.7% |
| Zimbabweans | 99.1 /100 | #102 | Exceptional 38.7% |
| Immigrants | Cameroon | 99.0 /100 | #103 | Exceptional 38.7% |
| Immigrants | Eritrea | 99.0 /100 | #104 | Exceptional 38.7% |
| Iraqis | 98.9 /100 | #105 | Exceptional 38.6% |
| Delaware | 98.8 /100 | #106 | Exceptional 38.6% |
| Chinese | 98.8 /100 | #107 | Exceptional 38.6% |
| Immigrants | Ethiopia | 98.7 /100 | #108 | Exceptional 38.6% |
| Lebanese | 98.7 /100 | #109 | Exceptional 38.6% |
| Maltese | 98.6 /100 | #110 | Exceptional 38.5% |
| Crow | 98.5 /100 | #111 | Exceptional 38.5% |
| Immigrants | Scotland | 98.5 /100 | #112 | Exceptional 38.5% |
Demographics Similar to Pima by In Labor Force | Age 16-19
In terms of in labor force | age 16-19, the demographic groups most similar to Pima are Immigrants from Russia (34.1%, a difference of 0.050%), Central American Indian (34.1%, a difference of 0.050%), Asian (34.1%, a difference of 0.070%), Immigrants from Asia (34.1%, a difference of 0.080%), and Immigrants from Peru (34.2%, a difference of 0.20%).
| Demographics | Rating | Rank | In Labor Force | Age 16-19 |
| Hispanics or Latinos | 1.1 /100 | #262 | Tragic 34.5% |
| Burmese | 1.1 /100 | #263 | Tragic 34.5% |
| Immigrants | Uruguay | 0.9 /100 | #264 | Tragic 34.4% |
| Immigrants | El Salvador | 0.7 /100 | #265 | Tragic 34.3% |
| Immigrants | Malaysia | 0.7 /100 | #266 | Tragic 34.3% |
| Immigrants | Peru | 0.5 /100 | #267 | Tragic 34.2% |
| Immigrants | Asia | 0.5 /100 | #268 | Tragic 34.1% |
| Pima | 0.5 /100 | #269 | Tragic 34.1% |
| Immigrants | Russia | 0.4 /100 | #270 | Tragic 34.1% |
| Central American Indians | 0.4 /100 | #271 | Tragic 34.1% |
| Asians | 0.4 /100 | #272 | Tragic 34.1% |
| Immigrants | Panama | 0.4 /100 | #273 | Tragic 34.0% |
| Venezuelans | 0.3 /100 | #274 | Tragic 34.0% |
| Immigrants | Fiji | 0.3 /100 | #275 | Tragic 33.9% |
| Immigrants | Latin America | 0.3 /100 | #276 | Tragic 33.9% |