South American vs Immigrants from Asia In Labor Force | Age 25-29
COMPARE
South American
Immigrants from Asia
In Labor Force | Age 25-29
In Labor Force | Age 25-29 Comparison
South Americans
Immigrants from Asia
84.7%
IN LABOR FORCE | AGE 25-29
54.9/ 100
METRIC RATING
168th/ 347
METRIC RANK
84.8%
IN LABOR FORCE | AGE 25-29
68.2/ 100
METRIC RATING
147th/ 347
METRIC RANK
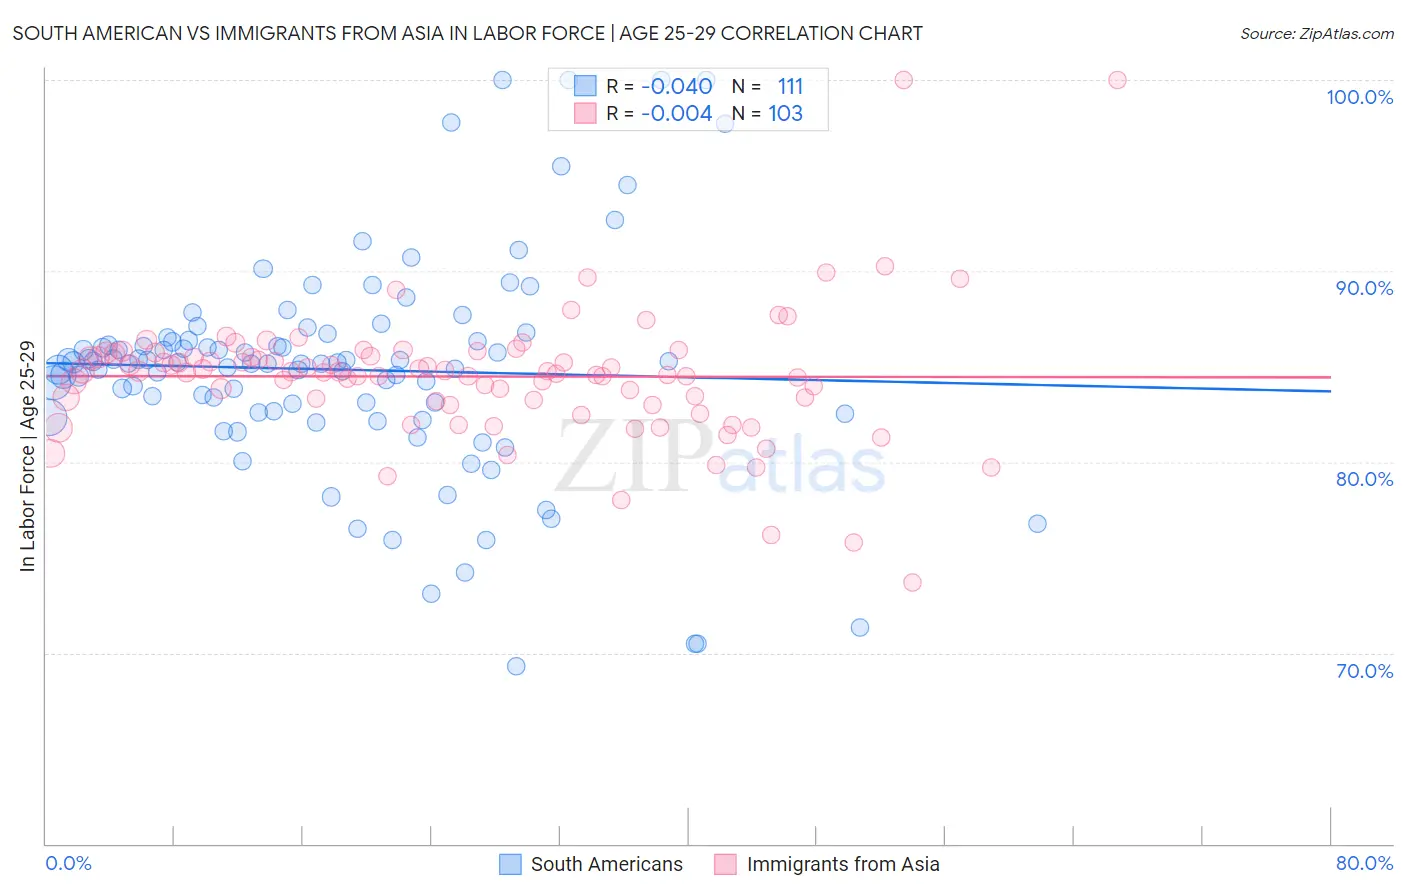
South American vs Immigrants from Asia In Labor Force | Age 25-29 Correlation Chart
The statistical analysis conducted on geographies consisting of 493,840,082 people shows no correlation between the proportion of South Americans and labor force participation rate among population between the ages 25 and 29 in the United States with a correlation coefficient (R) of -0.040 and weighted average of 84.7%. Similarly, the statistical analysis conducted on geographies consisting of 548,480,191 people shows no correlation between the proportion of Immigrants from Asia and labor force participation rate among population between the ages 25 and 29 in the United States with a correlation coefficient (R) of -0.004 and weighted average of 84.8%, a difference of 0.10%.
In Labor Force | Age 25-29 Correlation Summary
| Measurement | South American | Immigrants from Asia |
| Minimum | 69.3% | 73.7% |
| Maximum | 100.0% | 100.0% |
| Range | 30.7% | 26.3% |
| Mean | 84.8% | 84.5% |
| Median | 85.2% | 84.7% |
| Interquartile 25% (IQ1) | 82.6% | 83.2% |
| Interquartile 75% (IQ3) | 86.4% | 85.6% |
| Interquartile Range (IQR) | 3.7% | 2.5% |
| Standard Deviation (Sample) | 5.7% | 3.5% |
| Standard Deviation (Population) | 5.7% | 3.5% |
Similar Demographics by In Labor Force | Age 25-29
Demographics Similar to South Americans by In Labor Force | Age 25-29
In terms of in labor force | age 25-29, the demographic groups most similar to South Americans are Immigrants from Spain (84.7%, a difference of 0.010%), Indonesian (84.7%, a difference of 0.010%), Argentinean (84.7%, a difference of 0.020%), Ghanaian (84.7%, a difference of 0.020%), and Immigrants from Burma/Myanmar (84.7%, a difference of 0.020%).
| Demographics | Rating | Rank | In Labor Force | Age 25-29 |
| Canadians | 58.5 /100 | #161 | Average 84.7% |
| Immigrants | Colombia | 58.3 /100 | #162 | Average 84.7% |
| Argentineans | 57.9 /100 | #163 | Average 84.7% |
| Ghanaians | 57.6 /100 | #164 | Average 84.7% |
| Immigrants | Burma/Myanmar | 57.4 /100 | #165 | Average 84.7% |
| Immigrants | Spain | 56.9 /100 | #166 | Average 84.7% |
| Indonesians | 56.5 /100 | #167 | Average 84.7% |
| South Americans | 54.9 /100 | #168 | Average 84.7% |
| Celtics | 52.5 /100 | #169 | Average 84.7% |
| Tongans | 52.4 /100 | #170 | Average 84.7% |
| Immigrants | Vietnam | 50.5 /100 | #171 | Average 84.7% |
| Immigrants | Western Europe | 50.4 /100 | #172 | Average 84.7% |
| Assyrians/Chaldeans/Syriacs | 50.2 /100 | #173 | Average 84.7% |
| Palestinians | 50.0 /100 | #174 | Average 84.7% |
| Hungarians | 47.8 /100 | #175 | Average 84.6% |
Demographics Similar to Immigrants from Asia by In Labor Force | Age 25-29
In terms of in labor force | age 25-29, the demographic groups most similar to Immigrants from Asia are Immigrants from Senegal (84.8%, a difference of 0.0%), Icelander (84.8%, a difference of 0.0%), Sri Lankan (84.8%, a difference of 0.010%), Immigrants from Laos (84.8%, a difference of 0.010%), and Pakistani (84.8%, a difference of 0.020%).
| Demographics | Rating | Rank | In Labor Force | Age 25-29 |
| Immigrants | North America | 72.1 /100 | #140 | Good 84.8% |
| Danes | 71.9 /100 | #141 | Good 84.8% |
| Pakistanis | 70.0 /100 | #142 | Good 84.8% |
| Sri Lankans | 69.2 /100 | #143 | Good 84.8% |
| Immigrants | Laos | 69.0 /100 | #144 | Good 84.8% |
| Immigrants | Senegal | 68.3 /100 | #145 | Good 84.8% |
| Icelanders | 68.2 /100 | #146 | Good 84.8% |
| Immigrants | Asia | 68.2 /100 | #147 | Good 84.8% |
| Immigrants | England | 65.2 /100 | #148 | Good 84.7% |
| Peruvians | 64.7 /100 | #149 | Good 84.7% |
| Swiss | 64.7 /100 | #150 | Good 84.7% |
| Colombians | 62.8 /100 | #151 | Good 84.7% |
| Immigrants | Pakistan | 62.7 /100 | #152 | Good 84.7% |
| Immigrants | Taiwan | 62.2 /100 | #153 | Good 84.7% |
| Immigrants | Sri Lanka | 61.7 /100 | #154 | Good 84.7% |