Shoshone vs Immigrants from Mexico In Labor Force | Age 30-34
COMPARE
Shoshone
Immigrants from Mexico
In Labor Force | Age 30-34
In Labor Force | Age 30-34 Comparison
Shoshone
Immigrants from Mexico
81.4%
IN LABOR FORCE | AGE 30-34
0.0/ 100
METRIC RATING
319th/ 347
METRIC RANK
82.0%
IN LABOR FORCE | AGE 30-34
0.0/ 100
METRIC RATING
309th/ 347
METRIC RANK
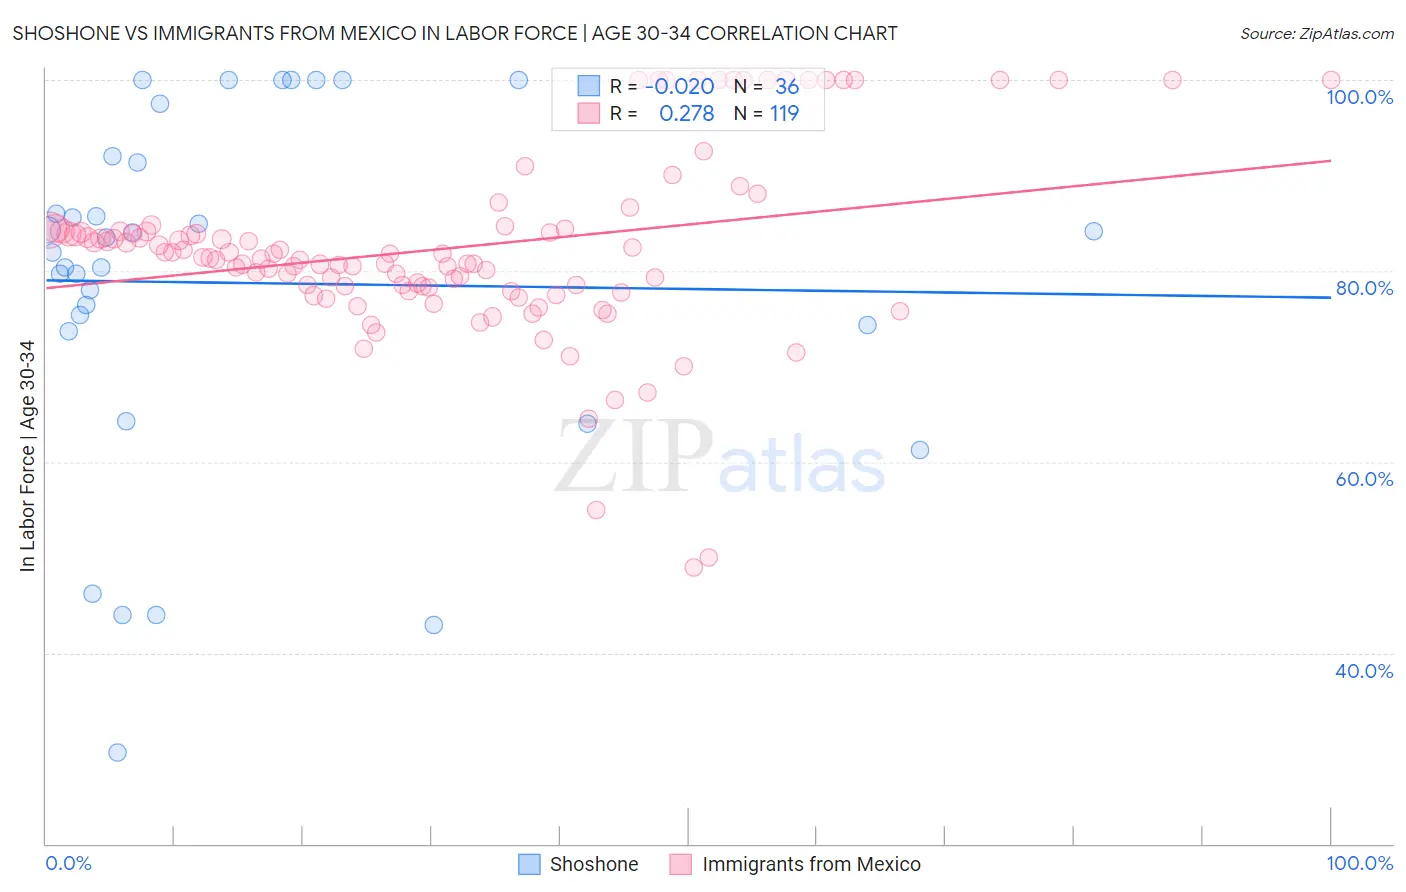
Shoshone vs Immigrants from Mexico In Labor Force | Age 30-34 Correlation Chart
The statistical analysis conducted on geographies consisting of 66,620,826 people shows no correlation between the proportion of Shoshone and labor force participation rate among population between the ages 30 and 34 in the United States with a correlation coefficient (R) of -0.020 and weighted average of 81.4%. Similarly, the statistical analysis conducted on geographies consisting of 513,160,418 people shows a weak positive correlation between the proportion of Immigrants from Mexico and labor force participation rate among population between the ages 30 and 34 in the United States with a correlation coefficient (R) of 0.278 and weighted average of 82.0%, a difference of 0.69%.
In Labor Force | Age 30-34 Correlation Summary
| Measurement | Shoshone | Immigrants from Mexico |
| Minimum | 29.5% | 49.0% |
| Maximum | 100.0% | 100.0% |
| Range | 70.5% | 51.0% |
| Mean | 78.8% | 82.4% |
| Median | 82.7% | 81.5% |
| Interquartile 25% (IQ1) | 74.0% | 78.2% |
| Interquartile 75% (IQ3) | 91.7% | 84.2% |
| Interquartile Range (IQR) | 17.7% | 6.0% |
| Standard Deviation (Sample) | 18.6% | 9.6% |
| Standard Deviation (Population) | 18.4% | 9.6% |
Demographics Similar to Shoshone and Immigrants from Mexico by In Labor Force | Age 30-34
In terms of in labor force | age 30-34, the demographic groups most similar to Shoshone are Choctaw (81.4%, a difference of 0.0%), Yaqui (81.4%, a difference of 0.020%), Arapaho (81.5%, a difference of 0.080%), Immigrants from the Azores (81.5%, a difference of 0.090%), and Alaska Native (81.3%, a difference of 0.10%). Similarly, the demographic groups most similar to Immigrants from Mexico are Cajun (82.0%, a difference of 0.020%), Chickasaw (81.9%, a difference of 0.070%), Mexican (81.9%, a difference of 0.070%), Iroquois (81.9%, a difference of 0.10%), and Puget Sound Salish (82.1%, a difference of 0.16%).
| Demographics | Rating | Rank | In Labor Force | Age 30-34 |
| Tlingit-Haida | 0.0 /100 | #304 | Tragic 82.3% |
| Osage | 0.0 /100 | #305 | Tragic 82.3% |
| Spanish American Indians | 0.0 /100 | #306 | Tragic 82.2% |
| Menominee | 0.0 /100 | #307 | Tragic 82.2% |
| Puget Sound Salish | 0.0 /100 | #308 | Tragic 82.1% |
| Immigrants | Mexico | 0.0 /100 | #309 | Tragic 82.0% |
| Cajuns | 0.0 /100 | #310 | Tragic 82.0% |
| Chickasaw | 0.0 /100 | #311 | Tragic 81.9% |
| Mexicans | 0.0 /100 | #312 | Tragic 81.9% |
| Iroquois | 0.0 /100 | #313 | Tragic 81.9% |
| Alaskan Athabascans | 0.0 /100 | #314 | Tragic 81.7% |
| Cherokee | 0.0 /100 | #315 | Tragic 81.6% |
| Immigrants | Azores | 0.0 /100 | #316 | Tragic 81.5% |
| Arapaho | 0.0 /100 | #317 | Tragic 81.5% |
| Choctaw | 0.0 /100 | #318 | Tragic 81.4% |
| Shoshone | 0.0 /100 | #319 | Tragic 81.4% |
| Yaqui | 0.0 /100 | #320 | Tragic 81.4% |
| Alaska Natives | 0.0 /100 | #321 | Tragic 81.3% |
| Puerto Ricans | 0.0 /100 | #322 | Tragic 81.2% |
| Paiute | 0.0 /100 | #323 | Tragic 81.2% |
| Cheyenne | 0.0 /100 | #324 | Tragic 81.1% |