Hopi vs New Zealander In Labor Force | Age 30-34
COMPARE
Hopi
New Zealander
In Labor Force | Age 30-34
In Labor Force | Age 30-34 Comparison
Hopi
New Zealanders
79.3%
IN LABOR FORCE | AGE 30-34
0.0/ 100
METRIC RATING
334th/ 347
METRIC RANK
85.0%
IN LABOR FORCE | AGE 30-34
89.5/ 100
METRIC RATING
133rd/ 347
METRIC RANK
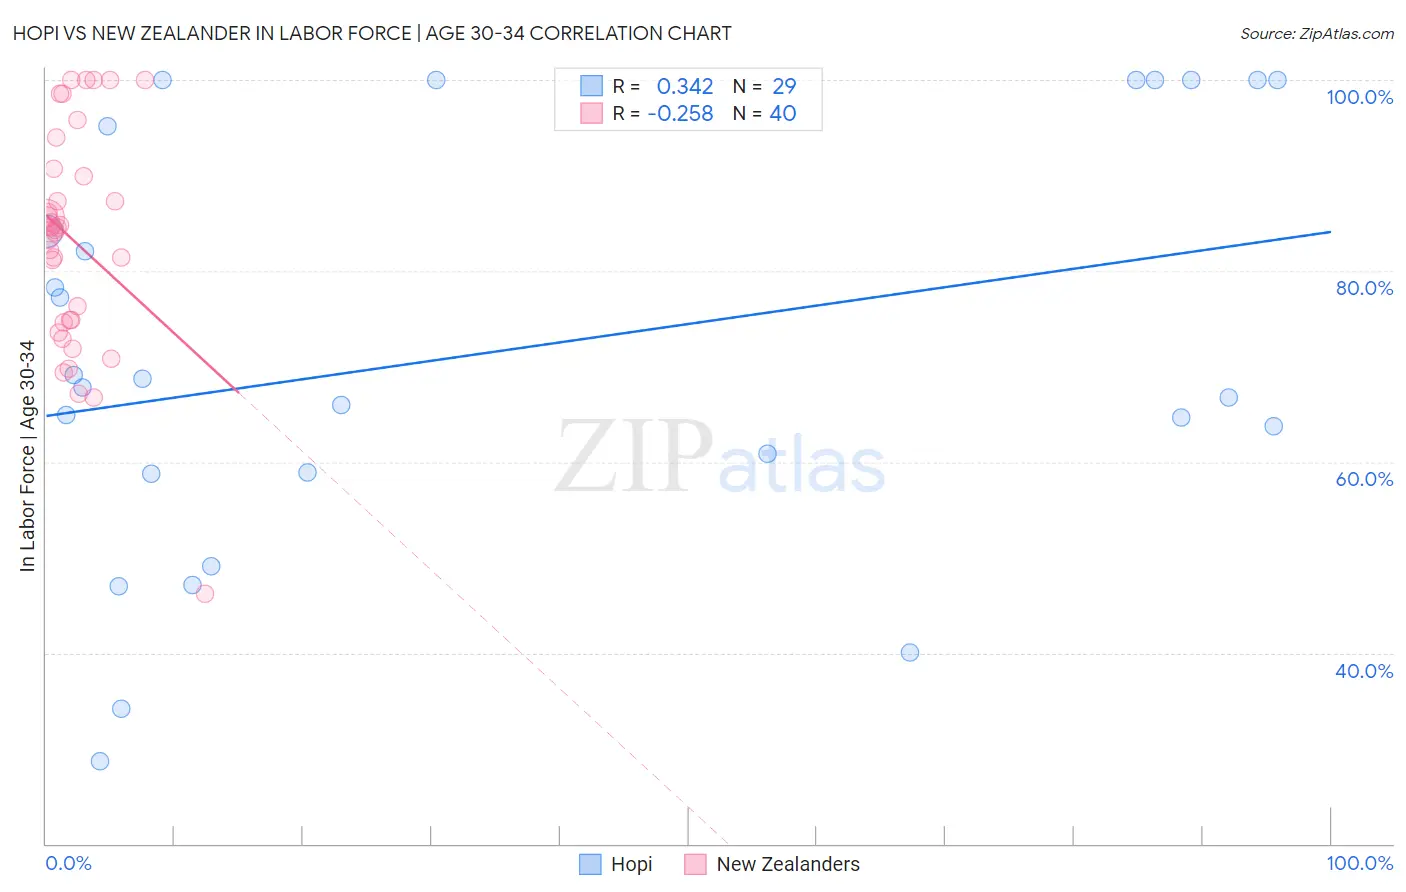
Hopi vs New Zealander In Labor Force | Age 30-34 Correlation Chart
The statistical analysis conducted on geographies consisting of 74,731,865 people shows a mild positive correlation between the proportion of Hopi and labor force participation rate among population between the ages 30 and 34 in the United States with a correlation coefficient (R) of 0.342 and weighted average of 79.3%. Similarly, the statistical analysis conducted on geographies consisting of 106,910,408 people shows a weak negative correlation between the proportion of New Zealanders and labor force participation rate among population between the ages 30 and 34 in the United States with a correlation coefficient (R) of -0.258 and weighted average of 85.0%, a difference of 7.2%.
In Labor Force | Age 30-34 Correlation Summary
| Measurement | Hopi | New Zealander |
| Minimum | 28.6% | 46.2% |
| Maximum | 100.0% | 100.0% |
| Range | 71.4% | 53.8% |
| Mean | 71.5% | 83.1% |
| Median | 67.8% | 84.4% |
| Interquartile 25% (IQ1) | 58.9% | 74.7% |
| Interquartile 75% (IQ3) | 97.6% | 90.3% |
| Interquartile Range (IQR) | 38.7% | 15.6% |
| Standard Deviation (Sample) | 21.7% | 11.7% |
| Standard Deviation (Population) | 21.3% | 11.6% |
Similar Demographics by In Labor Force | Age 30-34
Demographics Similar to Hopi by In Labor Force | Age 30-34
In terms of in labor force | age 30-34, the demographic groups most similar to Hopi are Marshallese (79.2%, a difference of 0.030%), Native/Alaskan (79.2%, a difference of 0.12%), Yakama (79.1%, a difference of 0.15%), Pima (79.0%, a difference of 0.28%), and Apache (79.0%, a difference of 0.30%).
| Demographics | Rating | Rank | In Labor Force | Age 30-34 |
| Colville | 0.0 /100 | #327 | Tragic 80.7% |
| Sioux | 0.0 /100 | #328 | Tragic 80.4% |
| Creek | 0.0 /100 | #329 | Tragic 80.4% |
| Pueblo | 0.0 /100 | #330 | Tragic 80.0% |
| Houma | 0.0 /100 | #331 | Tragic 79.9% |
| Kiowa | 0.0 /100 | #332 | Tragic 79.8% |
| Inupiat | 0.0 /100 | #333 | Tragic 79.7% |
| Hopi | 0.0 /100 | #334 | Tragic 79.3% |
| Marshallese | 0.0 /100 | #335 | Tragic 79.2% |
| Natives/Alaskans | 0.0 /100 | #336 | Tragic 79.2% |
| Yakama | 0.0 /100 | #337 | Tragic 79.1% |
| Pima | 0.0 /100 | #338 | Tragic 79.0% |
| Apache | 0.0 /100 | #339 | Tragic 79.0% |
| Ute | 0.0 /100 | #340 | Tragic 78.9% |
| Immigrants | Yemen | 0.0 /100 | #341 | Tragic 78.2% |
Demographics Similar to New Zealanders by In Labor Force | Age 30-34
In terms of in labor force | age 30-34, the demographic groups most similar to New Zealanders are Chinese (85.0%, a difference of 0.0%), Immigrants from Israel (85.0%, a difference of 0.0%), Immigrants from Western Africa (85.0%, a difference of 0.010%), Immigrants from Spain (85.0%, a difference of 0.010%), and Immigrants from Chile (85.0%, a difference of 0.010%).
| Demographics | Rating | Rank | In Labor Force | Age 30-34 |
| Austrians | 90.9 /100 | #126 | Exceptional 85.0% |
| Slavs | 90.7 /100 | #127 | Exceptional 85.0% |
| Immigrants | Argentina | 90.6 /100 | #128 | Exceptional 85.0% |
| Immigrants | Western Africa | 90.2 /100 | #129 | Exceptional 85.0% |
| Immigrants | Spain | 90.0 /100 | #130 | Exceptional 85.0% |
| Chinese | 89.6 /100 | #131 | Excellent 85.0% |
| Immigrants | Israel | 89.5 /100 | #132 | Excellent 85.0% |
| New Zealanders | 89.5 /100 | #133 | Excellent 85.0% |
| Immigrants | Chile | 89.2 /100 | #134 | Excellent 85.0% |
| Immigrants | Asia | 88.9 /100 | #135 | Excellent 85.0% |
| Jordanians | 88.6 /100 | #136 | Excellent 85.0% |
| South Africans | 88.0 /100 | #137 | Excellent 85.0% |
| Sri Lankans | 87.8 /100 | #138 | Excellent 85.0% |
| Bhutanese | 87.5 /100 | #139 | Excellent 85.0% |
| Immigrants | Vietnam | 86.5 /100 | #140 | Excellent 85.0% |