Immigrants from Grenada vs New Zealander In Labor Force | Age 30-34
COMPARE
Immigrants from Grenada
New Zealander
In Labor Force | Age 30-34
In Labor Force | Age 30-34 Comparison
Immigrants from Grenada
New Zealanders
83.5%
IN LABOR FORCE | AGE 30-34
0.0/ 100
METRIC RATING
275th/ 347
METRIC RANK
85.0%
IN LABOR FORCE | AGE 30-34
89.5/ 100
METRIC RATING
133rd/ 347
METRIC RANK
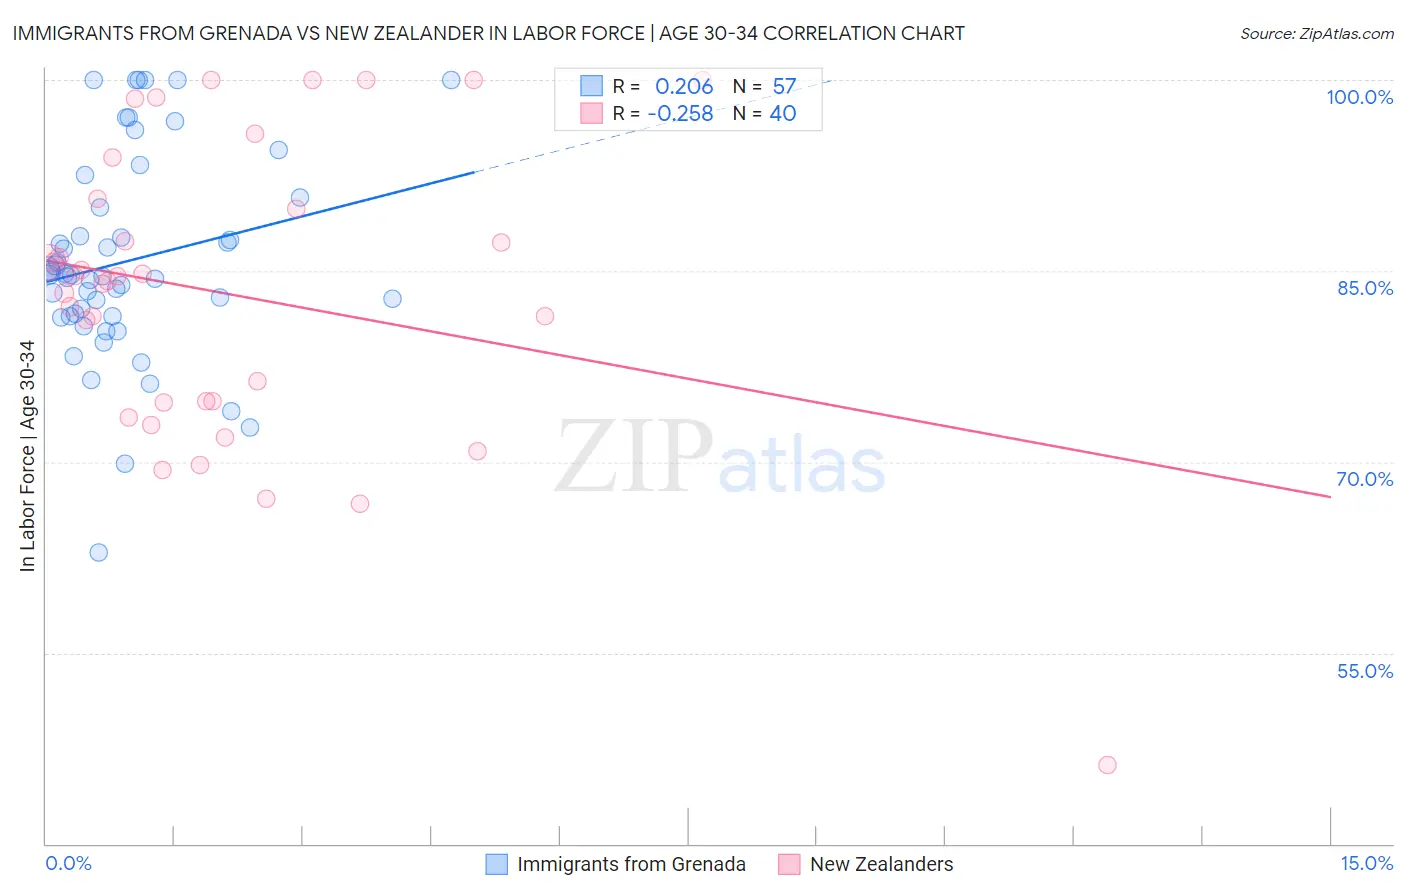
Immigrants from Grenada vs New Zealander In Labor Force | Age 30-34 Correlation Chart
The statistical analysis conducted on geographies consisting of 67,171,211 people shows a weak positive correlation between the proportion of Immigrants from Grenada and labor force participation rate among population between the ages 30 and 34 in the United States with a correlation coefficient (R) of 0.206 and weighted average of 83.5%. Similarly, the statistical analysis conducted on geographies consisting of 106,910,408 people shows a weak negative correlation between the proportion of New Zealanders and labor force participation rate among population between the ages 30 and 34 in the United States with a correlation coefficient (R) of -0.258 and weighted average of 85.0%, a difference of 1.8%.
In Labor Force | Age 30-34 Correlation Summary
| Measurement | Immigrants from Grenada | New Zealander |
| Minimum | 62.9% | 46.2% |
| Maximum | 100.0% | 100.0% |
| Range | 37.1% | 53.8% |
| Mean | 85.8% | 83.1% |
| Median | 84.7% | 84.4% |
| Interquartile 25% (IQ1) | 81.4% | 74.7% |
| Interquartile 75% (IQ3) | 90.4% | 90.3% |
| Interquartile Range (IQR) | 9.0% | 15.6% |
| Standard Deviation (Sample) | 8.0% | 11.7% |
| Standard Deviation (Population) | 7.9% | 11.6% |
Similar Demographics by In Labor Force | Age 30-34
Demographics Similar to Immigrants from Grenada by In Labor Force | Age 30-34
In terms of in labor force | age 30-34, the demographic groups most similar to Immigrants from Grenada are Belizean (83.5%, a difference of 0.010%), Tongan (83.5%, a difference of 0.010%), Guamanian/Chamorro (83.5%, a difference of 0.020%), Delaware (83.5%, a difference of 0.030%), and Spanish (83.5%, a difference of 0.070%).
| Demographics | Rating | Rank | In Labor Force | Age 30-34 |
| Immigrants | Bangladesh | 0.1 /100 | #268 | Tragic 83.6% |
| Vietnamese | 0.1 /100 | #269 | Tragic 83.6% |
| Spanish Americans | 0.0 /100 | #270 | Tragic 83.5% |
| Spanish | 0.0 /100 | #271 | Tragic 83.5% |
| Immigrants | Nonimmigrants | 0.0 /100 | #272 | Tragic 83.5% |
| Guamanians/Chamorros | 0.0 /100 | #273 | Tragic 83.5% |
| Belizeans | 0.0 /100 | #274 | Tragic 83.5% |
| Immigrants | Grenada | 0.0 /100 | #275 | Tragic 83.5% |
| Tongans | 0.0 /100 | #276 | Tragic 83.5% |
| Delaware | 0.0 /100 | #277 | Tragic 83.5% |
| Fijians | 0.0 /100 | #278 | Tragic 83.4% |
| Immigrants | Fiji | 0.0 /100 | #279 | Tragic 83.4% |
| Africans | 0.0 /100 | #280 | Tragic 83.4% |
| Samoans | 0.0 /100 | #281 | Tragic 83.3% |
| Mexican American Indians | 0.0 /100 | #282 | Tragic 83.2% |
Demographics Similar to New Zealanders by In Labor Force | Age 30-34
In terms of in labor force | age 30-34, the demographic groups most similar to New Zealanders are Chinese (85.0%, a difference of 0.0%), Immigrants from Israel (85.0%, a difference of 0.0%), Immigrants from Western Africa (85.0%, a difference of 0.010%), Immigrants from Spain (85.0%, a difference of 0.010%), and Immigrants from Chile (85.0%, a difference of 0.010%).
| Demographics | Rating | Rank | In Labor Force | Age 30-34 |
| Austrians | 90.9 /100 | #126 | Exceptional 85.0% |
| Slavs | 90.7 /100 | #127 | Exceptional 85.0% |
| Immigrants | Argentina | 90.6 /100 | #128 | Exceptional 85.0% |
| Immigrants | Western Africa | 90.2 /100 | #129 | Exceptional 85.0% |
| Immigrants | Spain | 90.0 /100 | #130 | Exceptional 85.0% |
| Chinese | 89.6 /100 | #131 | Excellent 85.0% |
| Immigrants | Israel | 89.5 /100 | #132 | Excellent 85.0% |
| New Zealanders | 89.5 /100 | #133 | Excellent 85.0% |
| Immigrants | Chile | 89.2 /100 | #134 | Excellent 85.0% |
| Immigrants | Asia | 88.9 /100 | #135 | Excellent 85.0% |
| Jordanians | 88.6 /100 | #136 | Excellent 85.0% |
| South Africans | 88.0 /100 | #137 | Excellent 85.0% |
| Sri Lankans | 87.8 /100 | #138 | Excellent 85.0% |
| Bhutanese | 87.5 /100 | #139 | Excellent 85.0% |
| Immigrants | Vietnam | 86.5 /100 | #140 | Excellent 85.0% |