Shoshone vs Pima In Labor Force | Age 20-24

COMPARE

Shoshone
Race
Ancestry
AfghanAfricanAlaska NativeAlaskan AthabascanAlbanianAleutAlsatianAmericanApacheArabArapahoArgentineanArmenianAssyrian/Chaldean/SyriacAustralianAustrianBahamianBangladeshiBarbadianBasqueBelgianBelizeanBermudanBhutaneseBlackfeetBolivianBrazilianBritishBritish West IndianBulgarianBurmeseCajunCambodianCanadianCape VerdeanCarpatho RusynCelticCentral AmericanCentral American IndianCherokeeCheyenneChickasawChileanChineseChippewaChoctawColombianColvilleComancheCosta RicanCreeCreekCroatianCrowCubanCypriotCzechCzechoslovakianDanishDelawareDominicanDutchDutch West IndianEastern EuropeanEcuadorianEgyptianEnglishEstonianEthiopianEuropeanFijianFilipinoFinnishFrenchFrench American IndianFrench CanadianGermanGerman RussianGhanaianGreekGuamanian/ChamorroGuatemalanGuyaneseHaitianHmongHonduranHopiHoumaHungarianIcelanderIndian (Asian)IndonesianInupiatIranianIraqiIrishIroquoisIsraeliItalianJamaicanJapaneseJordanianKenyanKiowaKoreanLaotianLatvianLebaneseLiberianLithuanianLumbeeLuxembourgerMacedonianMalaysianMalteseMarshalleseMenomineeMexicanMexican American IndianMongolianMoroccanNative HawaiianNavajoNepaleseNew ZealanderNicaraguanNigerianNorthern EuropeanNorwegianOkinawanOsageOttawaPaiutePakistaniPalestinianPanamanianParaguayanPennsylvania GermanPeruvianPolishPortuguesePotawatomiPuebloPuerto RicanPuget Sound SalishRomanianRussianSalvadoranSamoanScandinavianScotch-IrishScottishSeminoleSenegaleseSerbianShoshoneSierra LeoneanSiouxSlavicSlovakSloveneSomaliSouth AfricanSouth AmericanSouth American IndianSoviet UnionSpaniardSpanishSpanish AmericanSpanish American IndianSri LankanSubsaharan AfricanSudaneseSwedishSwissSyrianTaiwaneseThaiTlingit-HaidaTohono O'OdhamTonganTrinidadian and TobagonianTsimshianTurkishU.S. Virgin IslanderUgandanUkrainianUruguayanUteVenezuelanVietnameseWelshWest IndianYakamaYaquiYugoslavianYumanYup'ikZimbabwean
Immigration
NonimmigrantsImmigrantsAfghanistanAfricaAlbaniaArgentinaArmeniaAsiaAustraliaAustriaBahamasBangladeshBarbadosBelarusBelgiumBelizeBoliviaBosnia and HerzegovinaBrazilBulgariaBurma/MyanmarCabo VerdeCambodiaCameroonCanadaCaribbeanCentral AmericaChileChinaColombiaCongoCosta RicaCroatiaCubaCzechoslovakiaDenmarkDominicaDominican RepublicEastern AfricaEastern AsiaEastern EuropeEcuadorEgyptEl SalvadorEnglandEritreaEthiopiaEuropeFijiFranceGermanyGhanaGreeceGrenadaGuatemalaGuyanaHaitiHondurasHong KongHungaryIndiaIndonesiaIranIraqIrelandIsraelItalyJamaicaJapanJordanKazakhstanKenyaKoreaKuwaitLaosLatin AmericaLatviaLebanonLiberiaLithuaniaMalaysiaMexicoMicronesiaMiddle AfricaMoldovaMoroccoNepalNetherlandsNicaraguaNigeriaNorth AmericaNorth MacedoniaNorthern AfricaNorthern EuropeNorwayOceaniaPakistanPanamaPeruPhilippinesPolandPortugalRomaniaRussiaSaudi ArabiaScotlandSenegalSerbiaSierra LeoneSingaporeSomaliaSouth AfricaSouth AmericaSouth Central AsiaSouth Eastern AsiaSouthern EuropeSpainSri LankaSt. Vincent and the GrenadinesSudanSwedenSwitzerlandSyriaTaiwanThailandTrinidad and TobagoTurkeyUgandaUkraineUruguayUzbekistanVenezuelaVietnamWest IndiesWestern AfricaWestern AsiaWestern EuropeYemenZaireZimbabweAzores
Pima
Race
Ancestry
AfghanAfricanAlaska NativeAlaskan AthabascanAlbanianAleutAlsatianAmericanApacheArabArapahoArgentineanArmenianAssyrian/Chaldean/SyriacAustralianAustrianBahamianBangladeshiBarbadianBasqueBelgianBelizeanBermudanBhutaneseBlackfeetBolivianBrazilianBritishBritish West IndianBulgarianBurmeseCajunCambodianCanadianCape VerdeanCarpatho RusynCelticCentral AmericanCentral American IndianCherokeeCheyenneChickasawChileanChineseChippewaChoctawColombianColvilleComancheCosta RicanCreeCreekCroatianCrowCubanCypriotCzechCzechoslovakianDanishDelawareDominicanDutchDutch West IndianEastern EuropeanEcuadorianEgyptianEnglishEstonianEthiopianEuropeanFijianFilipinoFinnishFrenchFrench American IndianFrench CanadianGermanGerman RussianGhanaianGreekGuamanian/ChamorroGuatemalanGuyaneseHaitianHmongHonduranHopiHoumaHungarianIcelanderIndian (Asian)IndonesianInupiatIranianIraqiIrishIroquoisIsraeliItalianJamaicanJapaneseJordanianKenyanKiowaKoreanLaotianLatvianLebaneseLiberianLithuanianLumbeeLuxembourgerMacedonianMalaysianMalteseMarshalleseMenomineeMexicanMexican American IndianMongolianMoroccanNative HawaiianNavajoNepaleseNew ZealanderNicaraguanNigerianNorthern EuropeanNorwegianOkinawanOsageOttawaPaiutePakistaniPalestinianPanamanianParaguayanPennsylvania GermanPeruvianPimaPolishPortuguesePotawatomiPuebloPuerto RicanPuget Sound SalishRomanianRussianSalvadoranSamoanScandinavianScotch-IrishScottishSeminoleSenegaleseSerbianSierra LeoneanSiouxSlavicSlovakSloveneSomaliSouth AfricanSouth AmericanSouth American IndianSoviet UnionSpaniardSpanishSpanish AmericanSpanish American IndianSri LankanSubsaharan AfricanSudaneseSwedishSwissSyrianTaiwaneseThaiTlingit-HaidaTohono O'OdhamTonganTrinidadian and TobagonianTsimshianTurkishU.S. Virgin IslanderUgandanUkrainianUruguayanUteVenezuelanVietnameseWelshWest IndianYakamaYaquiYugoslavianYumanYup'ikZimbabwean
Immigration
NonimmigrantsImmigrantsAfghanistanAfricaAlbaniaArgentinaArmeniaAsiaAustraliaAustriaBahamasBangladeshBarbadosBelarusBelgiumBelizeBoliviaBosnia and HerzegovinaBrazilBulgariaBurma/MyanmarCabo VerdeCambodiaCameroonCanadaCaribbeanCentral AmericaChileChinaColombiaCongoCosta RicaCroatiaCubaCzechoslovakiaDenmarkDominicaDominican RepublicEastern AfricaEastern AsiaEastern EuropeEcuadorEgyptEl SalvadorEnglandEritreaEthiopiaEuropeFijiFranceGermanyGhanaGreeceGrenadaGuatemalaGuyanaHaitiHondurasHong KongHungaryIndiaIndonesiaIranIraqIrelandIsraelItalyJamaicaJapanJordanKazakhstanKenyaKoreaKuwaitLaosLatin AmericaLatviaLebanonLiberiaLithuaniaMalaysiaMexicoMicronesiaMiddle AfricaMoldovaMoroccoNepalNetherlandsNicaraguaNigeriaNorth AmericaNorth MacedoniaNorthern AfricaNorthern EuropeNorwayOceaniaPakistanPanamaPeruPhilippinesPolandPortugalRomaniaRussiaSaudi ArabiaScotlandSenegalSerbiaSierra LeoneSingaporeSomaliaSouth AfricaSouth AmericaSouth Central AsiaSouth Eastern AsiaSouthern EuropeSpainSri LankaSt. Vincent and the GrenadinesSudanSwedenSwitzerlandSyriaTaiwanThailandTrinidad and TobagoTurkeyUgandaUkraineUruguayUzbekistanVenezuelaVietnamWest IndiesWestern AfricaWestern AsiaWestern EuropeYemenZaireZimbabweAzores
In Labor Force | Age 20-24
Income
Poverty
Unemployment
Labor Participation
Family Structure
Vehicle Availability
Education Level
Disability

In Labor Force | Age 20-24 Comparison

Shoshone

Pima

Exceptional
Tragic
76.1%
IN LABOR FORCE | AGE 20-24
97.8/ 100
METRIC RATING
100th/ 347
METRIC RANK
69.0%
IN LABOR FORCE | AGE 20-24
0.0/ 100
METRIC RATING
338th/ 347
METRIC RANK

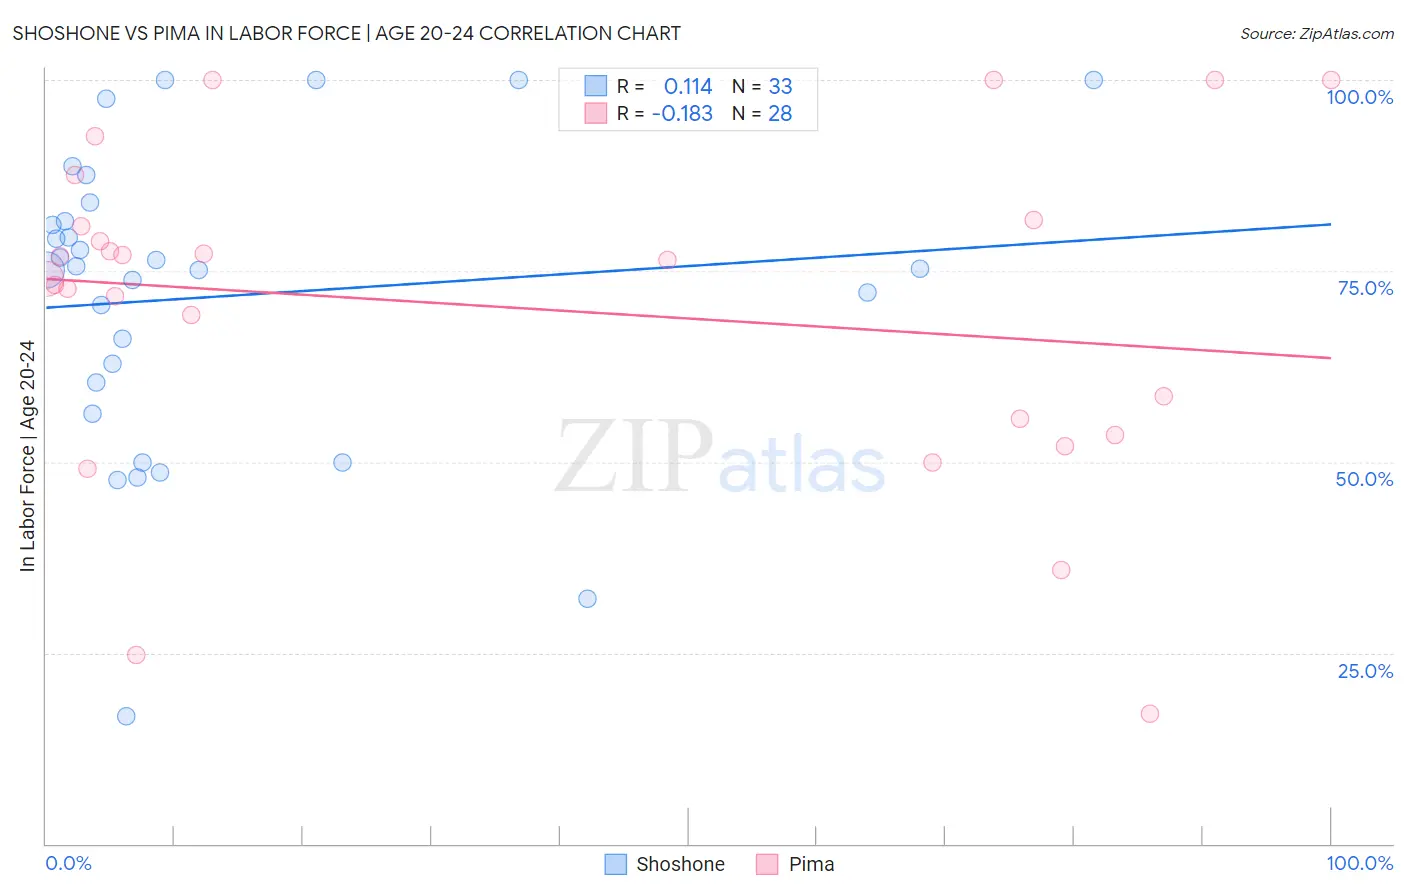
Shoshone vs Pima In Labor Force | Age 20-24 Correlation Chart

The statistical analysis conducted on geographies consisting of 66,581,429 people shows a poor positive correlation between the proportion of Shoshone and labor force participation rate among population between the ages 20 and 24 in the United States with a correlation coefficient (R) of 0.114 and weighted average of 76.1%. Similarly, the statistical analysis conducted on geographies consisting of 61,528,696 people shows a poor negative correlation between the proportion of Pima and labor force participation rate among population between the ages 20 and 24 in the United States with a correlation coefficient (R) of -0.183 and weighted average of 69.0%, a difference of 10.3%.
Shoshone vs Pima In Labor Force | Age 20-24

In Labor Force | Age 20-24 Correlation Summary

MeasurementShoshonePima
Minimum16.7%17.1%
Maximum100.0%100.0%
Range83.3%82.9%
Mean71.7%70.2%
Median75.4%75.2%
Interquartile 25% (IQ1)58.4%54.6%
Interquartile 75% (IQ3)82.8%81.2%
Interquartile Range (IQR)24.4%26.6%
Standard Deviation (Sample)19.9%21.8%
Standard Deviation (Population)19.6%21.4%

Similar Demographics by In Labor Force | Age 20-24

Demographics Similar to Shoshone by In Labor Force | Age 20-24

In terms of in labor force | age 20-24, the demographic groups most similar to Shoshone are American (76.1%, a difference of 0.0%), Immigrants from Poland (76.1%, a difference of 0.020%), Latvian (76.1%, a difference of 0.020%), Immigrants from Lithuania (76.1%, a difference of 0.040%), and Immigrants from Oceania (76.1%, a difference of 0.040%).
DemographicsRating | RankIn Labor Force | Age 20-24
Hungarians
98.9
/100
|
#93
Exceptional
76.3%
Potawatomi
98.5
/100
|
#94
Exceptional
76.2%
Immigrants | Germany
98.5
/100
|
#95
Exceptional
76.2%
Immigrants | Nonimmigrants
98.5
/100
|
#96
Exceptional
76.2%
Immigrants | Lithuania
98.0
/100
|
#97
Exceptional
76.1%
Immigrants | Oceania
98.0
/100
|
#98
Exceptional
76.1%
Americans
97.8
/100
|
#99
Exceptional
76.1%
Shoshone
97.8
/100
|
#100
Exceptional
76.1%
Immigrants | Poland
97.7
/100
|
#101
Exceptional
76.1%
Latvians
97.6
/100
|
#102
Exceptional
76.1%
Immigrants | North Macedonia
97.5
/100
|
#103
Exceptional
76.1%
Macedonians
97.2
/100
|
#104
Exceptional
76.0%
Immigrants | Nepal
97.2
/100
|
#105
Exceptional
76.0%
Immigrants | Uganda
97.1
/100
|
#106
Exceptional
76.0%
Greeks
96.9
/100
|
#107
Exceptional
76.0%

Demographics Similar to Pima by In Labor Force | Age 20-24

In terms of in labor force | age 20-24, the demographic groups most similar to Pima are Immigrants from Yemen (68.9%, a difference of 0.13%), Guyanese (69.2%, a difference of 0.26%), Immigrants from Guyana (69.3%, a difference of 0.39%), Menominee (68.7%, a difference of 0.44%), and Tohono O'odham (68.6%, a difference of 0.57%).
DemographicsRating | RankIn Labor Force | Age 20-24
Immigrants | Bangladesh
0.0
/100
|
#331
Tragic
70.6%
Immigrants | Uzbekistan
0.0
/100
|
#332
Tragic
70.4%
Yuman
0.0
/100
|
#333
Tragic
70.3%
British West Indians
0.0
/100
|
#334
Tragic
70.0%
Immigrants | Barbados
0.0
/100
|
#335
Tragic
69.7%
Immigrants | Guyana
0.0
/100
|
#336
Tragic
69.3%
Guyanese
0.0
/100
|
#337
Tragic
69.2%
Pima
0.0
/100
|
#338
Tragic
69.0%
Immigrants | Yemen
0.0
/100
|
#339
Tragic
68.9%
Menominee
0.0
/100
|
#340
Tragic
68.7%
Tohono O'odham
0.0
/100
|
#341
Tragic
68.6%
Immigrants | St. Vincent and the Grenadines
0.0
/100
|
#342
Tragic
68.4%
Puerto Ricans
0.0
/100
|
#343
Tragic
68.3%
Immigrants | Grenada
0.0
/100
|
#344
Tragic
67.2%
Hopi
0.0
/100
|
#345
Tragic
66.0%