Immigrants from Senegal vs Soviet Union In Labor Force | Age 20-64
COMPARE
Immigrants from Senegal
Soviet Union
In Labor Force | Age 20-64
In Labor Force | Age 20-64 Comparison
Immigrants from Senegal
Soviet Union
79.4%
IN LABOR FORCE | AGE 20-64
22.5/ 100
METRIC RATING
197th/ 347
METRIC RANK
80.2%
IN LABOR FORCE | AGE 20-64
98.5/ 100
METRIC RATING
71st/ 347
METRIC RANK
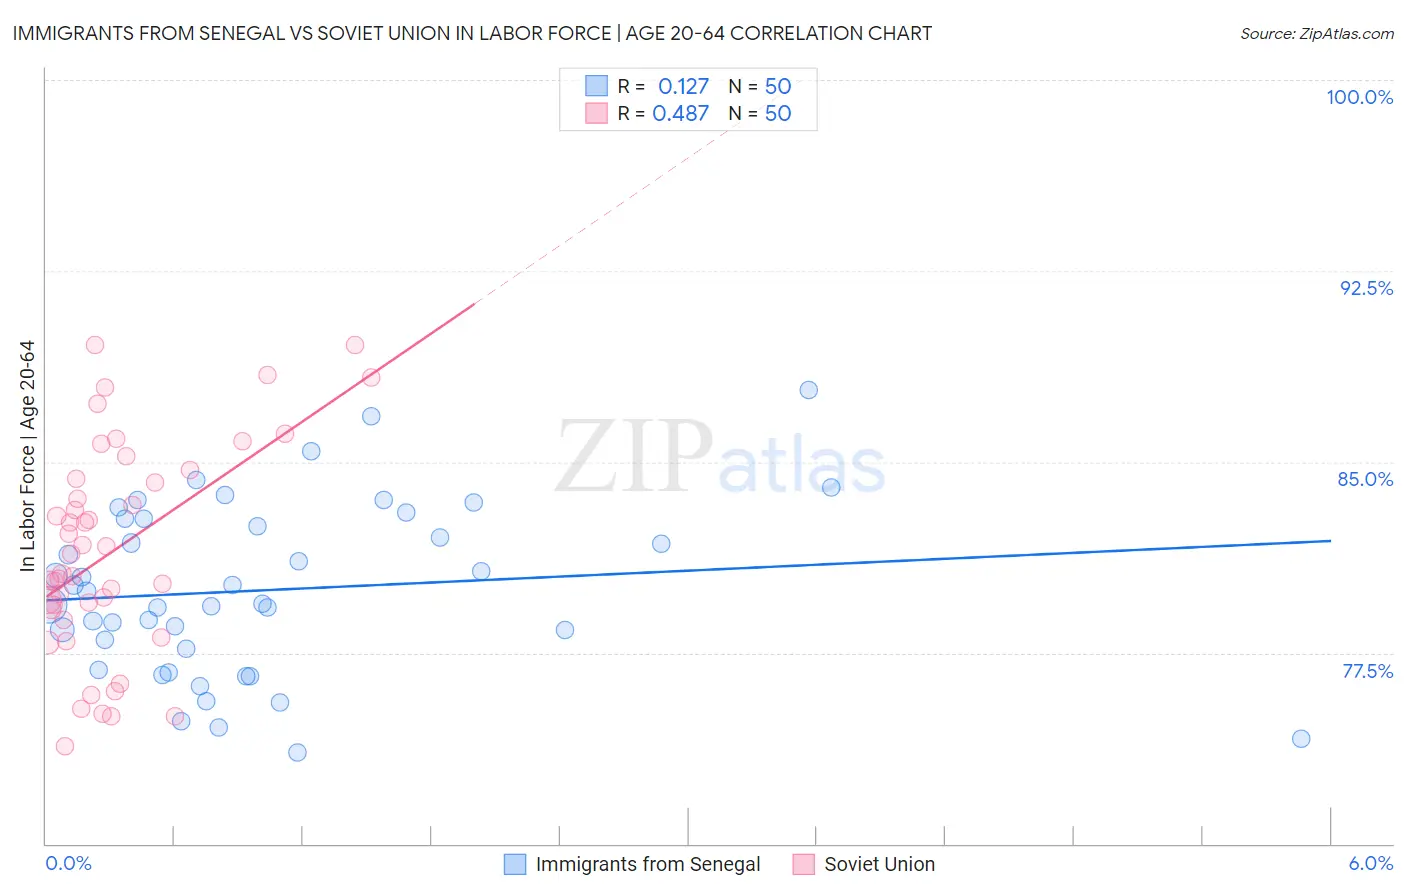
Immigrants from Senegal vs Soviet Union In Labor Force | Age 20-64 Correlation Chart
The statistical analysis conducted on geographies consisting of 90,128,419 people shows a poor positive correlation between the proportion of Immigrants from Senegal and labor force participation rate among population between the ages 20 and 64 in the United States with a correlation coefficient (R) of 0.127 and weighted average of 79.4%. Similarly, the statistical analysis conducted on geographies consisting of 43,514,626 people shows a moderate positive correlation between the proportion of Soviet Union and labor force participation rate among population between the ages 20 and 64 in the United States with a correlation coefficient (R) of 0.487 and weighted average of 80.2%, a difference of 1.1%.
In Labor Force | Age 20-64 Correlation Summary
| Measurement | Immigrants from Senegal | Soviet Union |
| Minimum | 73.6% | 73.8% |
| Maximum | 87.8% | 89.6% |
| Range | 14.2% | 15.8% |
| Mean | 80.0% | 81.5% |
| Median | 79.7% | 81.0% |
| Interquartile 25% (IQ1) | 77.6% | 79.2% |
| Interquartile 75% (IQ3) | 82.8% | 84.3% |
| Interquartile Range (IQR) | 5.1% | 5.1% |
| Standard Deviation (Sample) | 3.3% | 4.1% |
| Standard Deviation (Population) | 3.3% | 4.1% |
Similar Demographics by In Labor Force | Age 20-64
Demographics Similar to Immigrants from Senegal by In Labor Force | Age 20-64
In terms of in labor force | age 20-64, the demographic groups most similar to Immigrants from Senegal are Immigrants from Austria (79.4%, a difference of 0.010%), Ecuadorian (79.4%, a difference of 0.010%), Immigrants from Laos (79.4%, a difference of 0.010%), Immigrants from Thailand (79.4%, a difference of 0.020%), and Dutch (79.3%, a difference of 0.030%).
| Demographics | Rating | Rank | In Labor Force | Age 20-64 |
| Immigrants | Syria | 30.8 /100 | #190 | Fair 79.4% |
| Swiss | 28.9 /100 | #191 | Fair 79.4% |
| Immigrants | Denmark | 26.9 /100 | #192 | Fair 79.4% |
| Indonesians | 26.1 /100 | #193 | Fair 79.4% |
| Immigrants | Thailand | 24.8 /100 | #194 | Fair 79.4% |
| Immigrants | Austria | 23.7 /100 | #195 | Fair 79.4% |
| Ecuadorians | 23.1 /100 | #196 | Fair 79.4% |
| Immigrants | Senegal | 22.5 /100 | #197 | Fair 79.4% |
| Immigrants | Laos | 21.5 /100 | #198 | Fair 79.4% |
| Dutch | 20.2 /100 | #199 | Fair 79.3% |
| Immigrants | Oceania | 19.1 /100 | #200 | Poor 79.3% |
| Immigrants | Nicaragua | 19.0 /100 | #201 | Poor 79.3% |
| Nicaraguans | 18.3 /100 | #202 | Poor 79.3% |
| Iraqis | 17.7 /100 | #203 | Poor 79.3% |
| Immigrants | Cambodia | 17.6 /100 | #204 | Poor 79.3% |
Demographics Similar to Soviet Union by In Labor Force | Age 20-64
In terms of in labor force | age 20-64, the demographic groups most similar to Soviet Union are Bhutanese (80.2%, a difference of 0.010%), Albanian (80.2%, a difference of 0.010%), Immigrants from Turkey (80.2%, a difference of 0.010%), Eastern European (80.2%, a difference of 0.010%), and Macedonian (80.2%, a difference of 0.020%).
| Demographics | Rating | Rank | In Labor Force | Age 20-64 |
| Immigrants | Albania | 98.7 /100 | #64 | Exceptional 80.3% |
| Lithuanians | 98.7 /100 | #65 | Exceptional 80.2% |
| Macedonians | 98.7 /100 | #66 | Exceptional 80.2% |
| Taiwanese | 98.6 /100 | #67 | Exceptional 80.2% |
| Bhutanese | 98.6 /100 | #68 | Exceptional 80.2% |
| Albanians | 98.6 /100 | #69 | Exceptional 80.2% |
| Immigrants | Turkey | 98.5 /100 | #70 | Exceptional 80.2% |
| Soviet Union | 98.5 /100 | #71 | Exceptional 80.2% |
| Eastern Europeans | 98.4 /100 | #72 | Exceptional 80.2% |
| Cypriots | 98.2 /100 | #73 | Exceptional 80.2% |
| Immigrants | Eastern Europe | 98.1 /100 | #74 | Exceptional 80.2% |
| Immigrants | Afghanistan | 97.9 /100 | #75 | Exceptional 80.2% |
| Egyptians | 97.8 /100 | #76 | Exceptional 80.2% |
| Immigrants | Colombia | 97.8 /100 | #77 | Exceptional 80.2% |
| Immigrants | Romania | 97.8 /100 | #78 | Exceptional 80.2% |