French vs Soviet Union In Labor Force | Age 20-64
COMPARE
French
Soviet Union
In Labor Force | Age 20-64
In Labor Force | Age 20-64 Comparison
French
Soviet Union
78.9%
IN LABOR FORCE | AGE 20-64
1.5/ 100
METRIC RATING
244th/ 347
METRIC RANK
80.2%
IN LABOR FORCE | AGE 20-64
98.5/ 100
METRIC RATING
71st/ 347
METRIC RANK
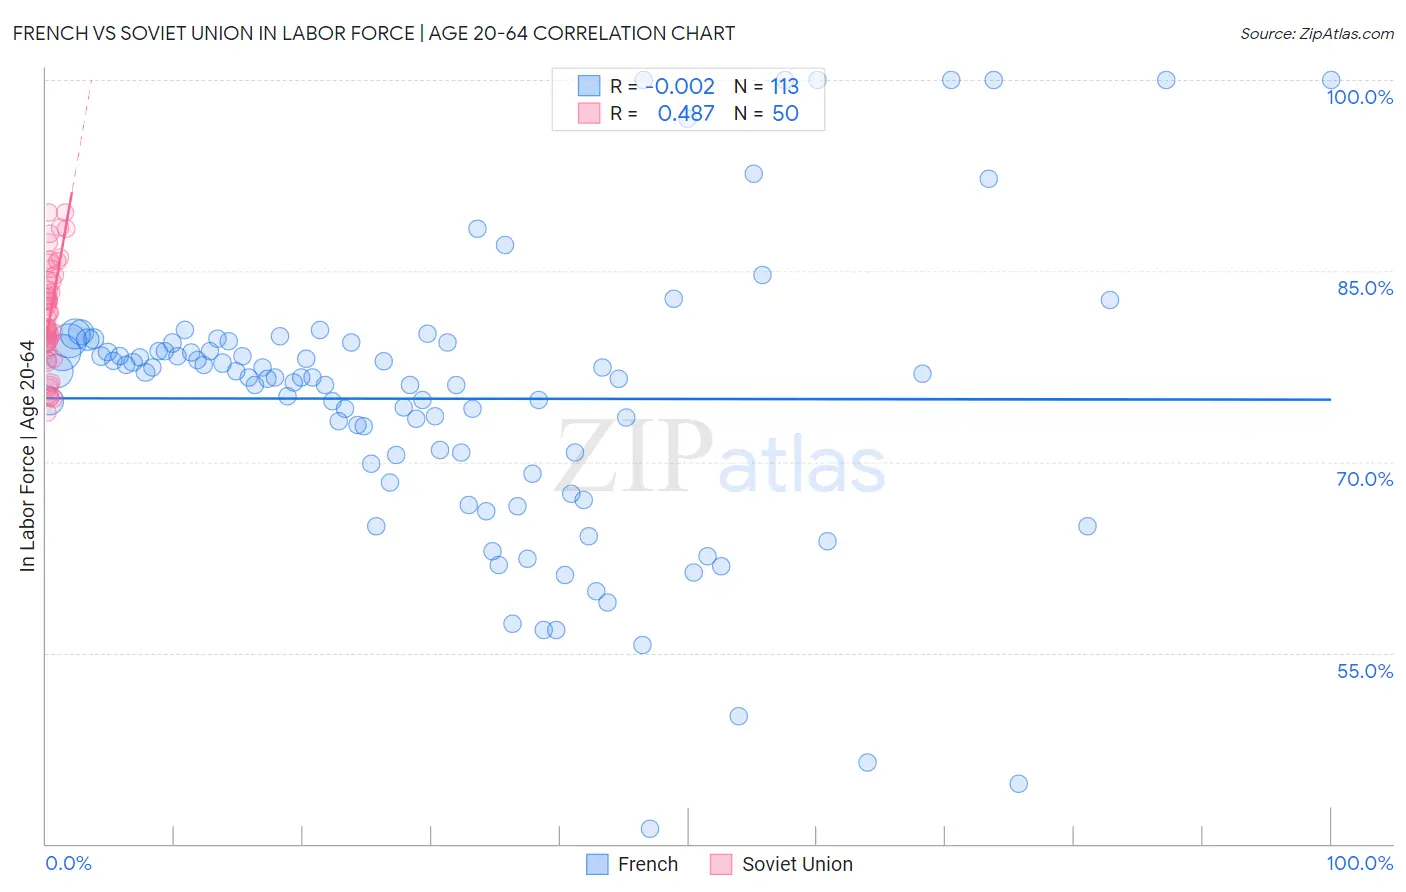
French vs Soviet Union In Labor Force | Age 20-64 Correlation Chart
The statistical analysis conducted on geographies consisting of 572,422,733 people shows no correlation between the proportion of French and labor force participation rate among population between the ages 20 and 64 in the United States with a correlation coefficient (R) of -0.002 and weighted average of 78.9%. Similarly, the statistical analysis conducted on geographies consisting of 43,514,626 people shows a moderate positive correlation between the proportion of Soviet Union and labor force participation rate among population between the ages 20 and 64 in the United States with a correlation coefficient (R) of 0.487 and weighted average of 80.2%, a difference of 1.7%.
In Labor Force | Age 20-64 Correlation Summary
| Measurement | French | Soviet Union |
| Minimum | 41.2% | 73.8% |
| Maximum | 100.0% | 89.6% |
| Range | 58.8% | 15.8% |
| Mean | 75.0% | 81.5% |
| Median | 76.6% | 81.0% |
| Interquartile 25% (IQ1) | 69.5% | 79.2% |
| Interquartile 75% (IQ3) | 79.3% | 84.3% |
| Interquartile Range (IQR) | 9.9% | 5.1% |
| Standard Deviation (Sample) | 11.2% | 4.1% |
| Standard Deviation (Population) | 11.2% | 4.1% |
Similar Demographics by In Labor Force | Age 20-64
Demographics Similar to French by In Labor Force | Age 20-64
In terms of in labor force | age 20-64, the demographic groups most similar to French are Immigrants from West Indies (78.9%, a difference of 0.030%), Scottish (78.9%, a difference of 0.040%), Immigrants from Micronesia (78.9%, a difference of 0.050%), Jamaican (78.9%, a difference of 0.060%), and Immigrants from Trinidad and Tobago (78.8%, a difference of 0.060%).
| Demographics | Rating | Rank | In Labor Force | Age 20-64 |
| Immigrants | North America | 2.9 /100 | #237 | Tragic 79.0% |
| Immigrants | Jamaica | 2.6 /100 | #238 | Tragic 79.0% |
| Welsh | 2.4 /100 | #239 | Tragic 79.0% |
| Trinidadians and Tobagonians | 2.3 /100 | #240 | Tragic 79.0% |
| Jamaicans | 2.0 /100 | #241 | Tragic 78.9% |
| Immigrants | Micronesia | 1.9 /100 | #242 | Tragic 78.9% |
| Immigrants | West Indies | 1.7 /100 | #243 | Tragic 78.9% |
| French | 1.5 /100 | #244 | Tragic 78.9% |
| Scottish | 1.3 /100 | #245 | Tragic 78.9% |
| Immigrants | Trinidad and Tobago | 1.1 /100 | #246 | Tragic 78.8% |
| Immigrants | Germany | 1.0 /100 | #247 | Tragic 78.8% |
| Immigrants | Caribbean | 1.0 /100 | #248 | Tragic 78.8% |
| English | 0.9 /100 | #249 | Tragic 78.8% |
| Hondurans | 0.8 /100 | #250 | Tragic 78.8% |
| Barbadians | 0.7 /100 | #251 | Tragic 78.8% |
Demographics Similar to Soviet Union by In Labor Force | Age 20-64
In terms of in labor force | age 20-64, the demographic groups most similar to Soviet Union are Bhutanese (80.2%, a difference of 0.010%), Albanian (80.2%, a difference of 0.010%), Immigrants from Turkey (80.2%, a difference of 0.010%), Eastern European (80.2%, a difference of 0.010%), and Macedonian (80.2%, a difference of 0.020%).
| Demographics | Rating | Rank | In Labor Force | Age 20-64 |
| Immigrants | Albania | 98.7 /100 | #64 | Exceptional 80.3% |
| Lithuanians | 98.7 /100 | #65 | Exceptional 80.2% |
| Macedonians | 98.7 /100 | #66 | Exceptional 80.2% |
| Taiwanese | 98.6 /100 | #67 | Exceptional 80.2% |
| Bhutanese | 98.6 /100 | #68 | Exceptional 80.2% |
| Albanians | 98.6 /100 | #69 | Exceptional 80.2% |
| Immigrants | Turkey | 98.5 /100 | #70 | Exceptional 80.2% |
| Soviet Union | 98.5 /100 | #71 | Exceptional 80.2% |
| Eastern Europeans | 98.4 /100 | #72 | Exceptional 80.2% |
| Cypriots | 98.2 /100 | #73 | Exceptional 80.2% |
| Immigrants | Eastern Europe | 98.1 /100 | #74 | Exceptional 80.2% |
| Immigrants | Afghanistan | 97.9 /100 | #75 | Exceptional 80.2% |
| Egyptians | 97.8 /100 | #76 | Exceptional 80.2% |
| Immigrants | Colombia | 97.8 /100 | #77 | Exceptional 80.2% |
| Immigrants | Romania | 97.8 /100 | #78 | Exceptional 80.2% |